 0009-0001-5382-7584
  mauge018@gmail.com
Doris Juliana Reinoso Peñafiel1
0009-0008-1035-9021 dorisreinoso@hotmail.comGliceria Gómez Ceballos1
0000-0001-6955-3293 gliceriapr@yahoo.es
Cooperativismo y Desarrollo, September-December 2025; 13(3), e948
Translated from the original in Spanish
Original article
The Quality House tool as a factor in strengthening small and medium-sized enterprises
Herramienta Casa de la Calidad como factor de fortalecimiento en las pequeñas y medianas empresas
A ferramenta Casa da Qualidade como fator de fortalecimento em pequenas e médias empresas
María Eugenia Romero Tintín1 0009-0001-5382-7584 mauge018@gmail.com
Doris Juliana Reinoso Peñafiel1 0009-0008-1035-9021 dorisreinoso@hotmail.com
Gliceria Gómez Ceballos1 0000-0001-6955-3293 gliceriapr@yahoo.es
1 Salesian Polytechnic University. Ecuador.
Received: 6/11/2025
Accepted: 20/12/2025
ABSTRACT
Currently, there are barriers that hinder the development of small businesses, one of which is the insufficient quality of the products they produce, which translates into low levels of competitiveness. The case study demonstrates the applicability of the Quality House tool in small businesses, specifically in the Association of Small Producers of Sweets and Preserves La Natividad de Chumblin, in Azuay, Ecuador. The objective was to contribute to strengthening the quality management of chamburo preserves and their positioning in the market. The Quality House methodology was applied within the framework of the deployment of the quality function, developing three main phases: identification of quality variables using the Delphi method; quality assessment based on consumer perception; and analysis of the competition, aimed at comparing the results obtained with the practices and standards present in the market. Recommendations were made, particularly with regard to the areas for improvement identified during the process that directly contributed to the achievement of the objective.
Keywords: quality; small producers; food preservation.
RESUMEN
Actualmente, existen barreras que obstaculizan el desarrollo de pequeñas empresas, una de ellas se concreta en la insuficiente calidad de los productos que generan, lo que se traduce en bajos niveles de competitividad. El estudio de caso demuestra la aplicabilidad de la herramienta Casa de la Calidad en pequeños negocios, específicamente en la Asociación de Pequeños Productores de Dulces y Conservas La Natividad de Chumblin, en Azuay, Ecuador. El objetivo fue contribuir al fortalecimiento de la gestión de calidad de conservas de chamburo y a su posicionamiento en el mercado. Se aplicó la metodología Casa de la Calidad en el marco del despliegue de la función de la calidad, desarrollándose tres fases principales: identificación de variables de calidad mediante el método Delphi; evaluación de la calidad basada en la percepción del consumidor y análisis de la competencia, orientado a contrastar los resultados obtenidos con las prácticas y estándares presentes en el mercado. Se plantearon recomendaciones especialmente con respecto a los puntos de mejoras identificados durante el proceso que tributaron directamente al cumplimiento del objetivo.
Palabras clave: calidad; pequeños productores; conservación de alimentos.
RESUMO
Atualmente, barreiras dificultam o desenvolvimento de pequenas empresas, sendo uma delas a qualidade insuficiente de seus produtos, resultando em baixos níveis de competitividade. Este estudo de caso demonstra a aplicabilidade da ferramenta Casa da Qualidade em pequenas empresas, especificamente na Associação La Natividad de Chumblin de Pequenos Produtores de Doces e Conservas em Azuay, Equador. O objetivo foi contribuir para o fortalecimento da gestão da qualidade das conservas de chamburo e seu posicionamento no mercado. A metodologia Casa da Qualidade foi aplicada no âmbito do Desdobramento da Função Qualidade (QFD), desenvolvendo três fases principais: identificação de variáveis de qualidade utilizando o método Delphi; avaliação da qualidade com base na percepção do consumidor; e análise competitiva, visando comparar os resultados obtidos com as práticas e padrões atuais do mercado. Recomendações foram feitas, especialmente em relação às áreas de melhoria identificadas durante o processo que contribuíram diretamente para o alcance do objetivo.
Palavras-chave: qualidade; pequenos produtores; conservação de alimentos.
INTRODUCTION
In Latin America, entrepreneurship has established itself as a key alternative for job creation. Countries such as Ecuador (32.65%), Panama (31.35%), Chile (31.05%), Uruguay (26.24%), and Colombia (32.57%) have the highest rates of Early-Stage Entrepreneurial Activity (GEM, 2024).
Small and medium-sized enterprises (SMEs), many of which are artisanal and family-owned, have evolved with industrialization and globalization, establishing themselves as key players in economic development, innovation, and employment. However, they face structural barriers that hinder their consolidation, such as limited access to financing, strict regulation, skills shortages, and poor infrastructure, in a context marked by uncertainty surrounding trade policy, which also threatens market access (World Bank, 2024). Added to this are poor technological infrastructure, low adoption of advanced technologies, and a lack of professionalization, in a regional scenario characterized by a complex macroeconomic situation, marked by a slowdown in economic growth and trade, rising inflation, an adverse fiscal situation, rising interest rates, and a notable decline in formal employment, all of which were the main focus of economic policy during that period (OECD et al., 2024).
In this scenario, globalization imposes standards of quality and efficiency that many SMEs are unable to meet. Exclusion from innovation networks and the fragmentation of knowledge deepen socioeconomic inequality. In addition, these companies face operational informality and a lack of innovation strategies based on incremental and, to a lesser extent, radical breakthroughs, maintaining an adaptive organizational culture but with strong resistance to changing cultural patterns inherited from the business founders (Müller & Lucero Bringas, 2024). Overcoming these challenges requires a comprehensive approach that combines financing, social innovation, and adaptation to local contexts.
In this context, quality is positioned as a strategic axis. Its implementation from early stages improves customer satisfaction, strengthens reputation, promotes loyalty, and facilitates access to new markets; it also optimizes resources, reduces errors, and improves profitability. The concept of quality encompasses dimensions such as customer satisfaction (Defeo, 2023), regulatory compliance (ISO, 2015), continuous improvement (Deming, 2000), efficiency, and food safety, which form the basis of the Food Safety Management System. The benefits of this system focus on the ability to consistently provide safe food and products, as well as services that meet customer requirements and applicable legal and regulatory requirements; address the risks associated with its objectives; and, finally, demonstrate compliance with the specified requirements of the system (ISO, 2018).
Quality systems have evolved from product inspection to comprehensive models, such as quality assurance, total quality management, ISO 9001 standards (ISO, 2015), and the implementation of agile methodologies. For SMEs, systems such as ISO 9001:2015 (Carrero et al., 2021), Lean Management, Lean Six Sigma (Alexander et al., 2019), and hybrid methodologies stand out.
Within the framework of the evolution of these systems, the Quality Function Deployment (QFD), developed by Akao and Mizuno, stands out. It allows customer expectations to be integrated into design and production using a tool called the House of Quality (Akao, 2024). This methodology facilitates the translation of customer needs into technical specifications, process improvement, and strategic planning, optimizing resources and reducing costs.
Empirical studies support its effectiveness. Such is the case in Peru, where the use of quality improvement tools strengthened the competitiveness of textile clusters (Ledesma Munive, 2024). Similarly, research in Polish industrial companies demonstrated the positive effects of implementing quality management systems on competitiveness; interviews with entrepreneurs revealed that such systems are an integral part of their competitive strategies (Wyrwa & Ziółkowski, 2015).
No recent references to studies on the canning industry were found. Nevertheless, in the case of the peach canning industry in Rio Grande do Sul, Brazil, a study on the vertical coordination of its hierarchical structures showed that quality-oriented management facilitates backward integration in the value chain, which directly influences the sector's competitiveness levels (Rigatto et al., 2005).
For its part, the Spanish fruit and vegetable canning industry shows how an emphasis on product quality and cost efficiency has enabled it to maintain a strong export orientation and a competitive advantage in international markets (Medina Albaladejo, 2010).
Finally, the analysis carried out by Martínez Paz et al. (2005) highlights the so-called "dual effect" existing between companies in the sector in the region of Murcia, Spain. The gaps between their production structures and the coexistence of large companies with small producers place the latter at a clear disadvantage in achieving the quality standards necessary to compete in the market.
However, the temporary gap identified in references related to quality management in food production, in contrast to other productive sectors, allows to infer that quality management assurance in this sector is essential to comply with international regulations, such as those of the United States Food and Drug Administration and the European Food Safety Authority, as well as to respond to consumers who value certified, sustainable, and safe products.
In Ecuador, canned food production is regulated by the National Institute of Standardization and the National Agency for Regulation, Control, and Health Surveillance, entities responsible for supervising production processes, labeling, and storage, which are essential aspects for complying with local and international market standards. Quality is a differentiating factor compared to imported products; however, small associations face technological limitations, regulatory ignorance, and difficulties in sourcing raw materials (National Agency for Regulation, Control, and Health Surveillance [ARCSA], 2024).
On the other hand, the export of preserves faces obstacles such as obtaining international health registrations, compliance with safety regulations, traceability of ingredients, certification of origin, and tariff costs. In this context, quality becomes a strategic opportunity to access new markets that support the internationalization of agricultural products produced by small producers.
This study was conducted in the parish of Chumblín, San Fernando canton, where the Association of Small Producers of Sweets and Preserves La Natividad de Chumblín, founded in 2007, operates. This women-led organization promotes local development by producing products derived from chamburo (Carica pubescens), an Andean fruit with high nutritional value. However, the association faces challenges in standardizing processes and quality control, which are fundamental aspects for ensuring the safety and acceptance of its products in demanding markets.
In response to this problem, the objective of this study was to contribute to strengthening the quality management of chamburo preserves and their market positioning through the application of the Quality House tool. This allowed for the identification of areas for improvement in the production and marketing processes of the product, on the basis of which viable alternative solutions were generated that can serve as a frame of reference for similar studies in the context of small and medium-sized enterprises in the food sector.
MATERIALS AND METHODS
The Quality House tool
QFD, or Quality Function Deployment, was established in Japan in the 1960s as a methodology aimed at linking customer needs with product technical specifications. The tool known as the Quality House is a systematic method for translating these needs into the technical characteristics of a product or service, and represents the main and best-known matrix within QFD.
This tool allows to interpret what customers want and how those needs can be met; it also facilitates the transition from the "what" (customer needs) to the "how" (technical responses). These elements are commonly referred to as CTQ (Critical to Quality). Both the "whats" and the "hows" are defined by experts, whose work is strengthened by brainstorming sessions involving interdisciplinary teams.
This methodology consists of nine fundamental areas, as shown in figure 1.
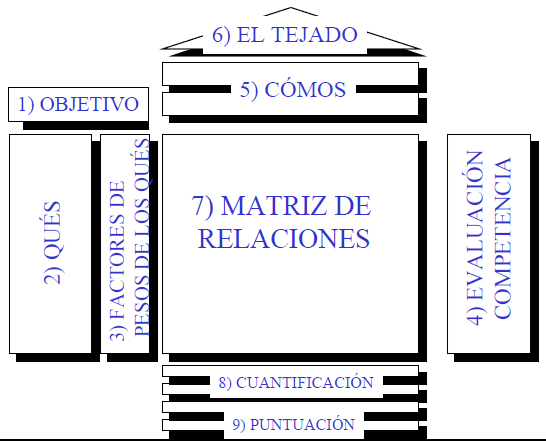
Figure 1. Matrix diagram: QFD
Source: Quality Function Deployment (Ruiz-Falcó Rojas, 2009)
Following this methodology, the following steps were carried out:
In these steps, the variables linked to the quality of the chamburo preserve were defined and validated by competitors and customers. Based on these results, a proposal for brand recommendations was developed.
Phase 1. Determination of variables
A sample of 20 experts was selected using the snowball technique. They had to meet the following profile:
The expert consultation process was carried out using quality criteria (QC) related to chamburo preservation, through a questionnaire consisting of a total of four open and closed questions. Based on the experts' assessments, the most relevant criteria were identified using the Pareto chart. To construct this chart, a frequency table was created to determine the number of times each criterion was repeated.
With the information obtained and with the aim of ranking the criteria expressed by the experts, the percentage of importance of the quality criteria was determined, according to equation:
Information was collected through interviews with the president of the association, who, based on her experience and knowledge, defined the following aspects:
Phase 2. Quality assessment
In this phase, product quality was assessed from two perspectives:
The Percentage Rating per Quality Requirement (PCRC in Spanish) using equation:
The dependence of customer requirements (CR) was assessed by assigning each paired comparison a rating of 5 (RF), 4 (RP), 3 (RN), 2 (RNF), or 1 (SR).
Customer perception of the value of the venture's product compared to the competition was evaluated. Indirect competitors identified by the association representative were not considered because customers were unfamiliar with those brands. For this reason, the survey questions focused on comparing chamburo preserves with other preserves on the market.
To this end, a sample of 31 customers was taken, using critical sampling criteria; that is, customers previously identified by the association. In order to determine consumers' perceptions of the venture's product in relation to its competitors, descriptive statistical measures such as arithmetic mean and standard deviation were used.
The Shapiro-Wilk test was applied to assess the normality of the data. The result yielded a value of p > 0.05, so the hypothesis of normality was accepted.
However, although the Shapiro-Wilk test indicated normality in the data, the nonparametric Friedman test was chosen due to the ordinal nature of the ratings, with the aim of applying a more conservative analysis that would allow significant differences between the samples to be identified.
The following hypotheses were proposed:
To determine the criteria representing the greatest variability, the Friedman test for a two-factor ANOVA was used to demonstrate the level of statistical significance.
Phase 3. Recommendations for the venture
Recommendations were made based on the identification of areas for improvement in quality management, supported by the processing and analysis of relevant information. The results obtained were evaluated using FOAR (Strengths, Opportunities, Aspirations, and Results) analysis, based on the following aspects:
In addition, based on the information provided by the representative of the venture, a matrix of indicators was developed.
RESULTS AND DISCUSSION
In accordance with the methodology described above, the results derived from the collection and processing of information are presented below.
Phase 1. Recognition of variables for quality assessment
The quality criteria indicated by the experts are shown in the following table.
Table 1. Experts' quality criteria
Expert No. |
Quality Criteria |
1 |
The degree of ripeness of the fruit and the preservatives used to extend the product's shelf life. |
2 |
Packaging, as containers must be airtight and sterile. In addition to this, another important parameter is sealing, which prevents future contamination of the product. |
3 |
Active ingredients (fruit of excellent quality), preservatives, packaging, labeling, storage, transportation. |
4 |
Raw material (chamburo), preservatives, packaging. |
5 |
Packaging, flavor, pH, quantity, and moisture. |
6 |
The packaging must be properly sterilized, with the appropriate water activity and pH. |
7 |
PH, type of packaging, type of sterilization. |
8 |
Control of machine and personnel sterilization during production. Do not use chemical ingredients at the maximum permitted limits to make the product last longer, as this affects product quality. |
9 |
The filling liquid. |
10 |
The color, proper consistency, and above all, the flavor. |
11 |
Composition, stability, aroma, purity, color. |
12 |
Flavor, presentation, compliance with regulations, cleanliness. |
13 |
Brix degrees, pH of the preserve, characteristic color and smell of the chamburo. |
14 |
Amount of sugar |
15 |
Sterility of the production environment. |
16 |
Consistency, ripeness, nutritional values. |
17 |
Hygiene and health standards, checking pH, container tightness, correct storage, and commercial sterility control. |
18 |
Climatic conditions in which it is found or stored, in addition to growing conditions. |
19 |
The ripeness of the fruit. |
20 |
Made with organic fruit, no preservatives, no added sugars, nutritional value |
Source: own elaboration based on primary information
The variables identified by the experts in the table above were analyzed by the researchers. After refining the list according to their relationship or similarity, these variables were grouped into eight categories, which facilitated their analysis and allowed priority levels to be defined. The result of this process is presented below:
In summary, the criteria used were as follows:
In order to summarize the most relevant quality criteria, according to expert opinion, a frequency table was drawn up, from which the Pareto diagram presented below was constructed.
Table 2. Frequency table of quality criteria (QC) in accordance with expert criteria
No. |
Variables |
Frequency |
Cumulative Absolute Frequency |
Relative Frequency |
Cumulative Relative Frequency |
1 |
Sensory nutritional attributes |
16 |
16 |
26.23 |
26.23 |
2 |
Manufacturing and processing |
13 |
29 |
21.31 |
47.54 |
3 |
Conservation and security |
11 |
40 |
18.03 |
65.57 |
4 |
Physicochemical properties |
10 |
50 |
16.39 |
81.97% |
5 |
Quality of raw materials |
7 |
57 |
11.48 |
93.44 |
6 |
Rules and regulations |
2 |
59 |
3.28 |
96.72 |
7 |
Logistics and transport |
1 |
60 |
1.64 |
98.36 |
8 |
Presentation/labeling |
1 |
61 |
1.64% |
100.00% |
Total |
|
61 |
|
100.00 |
|
Source: own elaboration based on primary information
Based on the frequency table, the Pareto chart below shows the most relevant quality criteria:
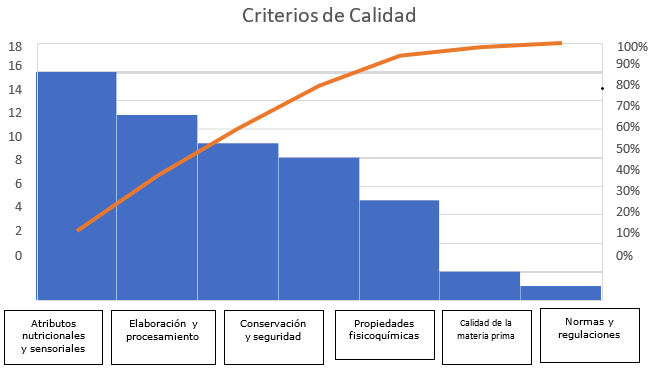
Figure 2. Pareto diagram
Source: own elaboration based on primary information
The quality criteria identified as most relevant according to the Pareto diagram analysis are shown in table 3.
Table 3. Frequency table of the most relevant quality criteria
No. |
Variables |
Frequency |
Cumulative Absolute Frequency |
Relative Frequency |
Cumulative Relative Frequency |
1 |
Nutritional and Sensory Attributes |
16 |
16 |
32 |
32 |
2 |
Manufacturing and processing |
13 |
29 |
26 |
58 |
3 |
Conservation and safety |
11 |
40 |
22 |
80 |
4 |
Physicochemical properties |
10 |
50 |
20% |
100% |
Source: own elaboration based on primary information
The Importance Rating Percentage (IRP) of the CCs yielded the following result:
The factors linked to quality assurance requirements (QR) were obtained from the interview with the association representative. According to her criteria, these factors are: adequate assets, ongoing training programs, product quality control, compliance with basic regulations, and documented production processes.
Similarly, indirect competitors were identified based on the criteria of the association representative. Given that there are no producers of chamburo preserves in the area, the result was as follows: Salinerito and Agrovida.
Phase 2. Quality assessment
Table 4 presents the information obtained in the interview with the association representative.
Table 4. CC-RC Matrix
RC Assessment |
Quality control |
1 |
---- |
---- |
---- |
---- |
|
Documented production process |
5 |
1 |
---- |
---- |
---- |
||
Continuing education programs |
4 |
4 |
1 |
---- |
---- |
||
Compliance with basic regulations |
4 |
5 |
5 |
1 |
---- |
||
Eligible assets |
4 |
4 |
4 |
5 |
1 |
||
Quality Requirements |
Quality control |
Documented production processes |
Continuous training programs |
Compliance with basic regulations |
Adequate assets |
||
Quality Criteria |
Importance value |
PCI |
CC-RC Matrix |
||||
Nutritional and sensory attributes |
5 |
28 |
9 |
1 |
3 |
3 |
3 |
Production and processing |
4 |
22 |
9 |
3 |
3 |
9 |
9 |
Storage and safety |
5 |
28 |
9 |
3 |
3 |
9 |
9 |
Physicochemical properties |
4 |
22% |
9 |
3 |
3 |
3 |
3 |
Total |
100% |
|
|||||
Importance rating |
9.00 |
2.44 |
3.00 |
6.0 |
6.00 |
||
Percentage rating by quality requirement |
34 |
9 |
11 |
23 |
23 |
||
Source: own elaboration based on primary information
According to the matrix constructed between the quality criteria identified by the experts and the quality requirements assured by the association representative, quality control stands out as the most important factor. This factor has a weight of 34% to ensure that the quality criteria formulated by the experts are met in the chamburo preserve product.
Consumer perceptions of canned chamburo, in relation to other canned fruits on the market, yielded the following values, shown in table 5.
Table 5. Consumer perception matrix
Quality criteria |
Average |
Standard deviation |
Nutritional and sensory attributes |
4.06 |
1.15 |
Preparation and processing |
4.03 |
1.11 |
Preservation and safety |
3.52 |
1.34 |
Physicochemical properties |
3.84 |
1.24 |
Source: own elaboration based on primary information
The normality of the ratings given by customers, evaluated using the Shapiro-Wilk statistic, was as follows:
The results showed a p-value > 0.05, so the normality hypothesis was accepted.
In accordance with the methodology, the Friedman test was applied to compare the existence of significant differences in the ratings between Chamburo preserves and those of the competition. This test showed statistically significant differences in consumers' perception of quality, with a p-value of 0.001 (p < 0.05).
To identify the criteria representing the greatest variability, the Friedman test was used for a two-factor ANOVA, revealing the following levels of significance:
The analysis of consumer perception revealed that physicochemical properties show the greatest difference in relation to nutritional and sensory attributes and preservation and safety, which positions this criterion as the main factor of differentiation from the competition.
Through Pareto analysis applied to the percentage ratings for each quality requirement, quality control, regulatory compliance, and the availability of adequate assets were identified as strengths of the venture. From the consumer's perspective, nutritional and sensory attributes, preservation and safety, and the manufacturing process were the most highly valued criteria. The product stands out for its vitamin A and C content, essential minerals, and antioxidant properties, as well as its flavor, texture, and artisanal production without preservatives, which reinforces its positioning as a healthy food.
Among the opportunities for improvement, the need to document production processes, implement ongoing training programs, and strengthen natural preservation methods was identified. Likewise, the development of a procedures manual is recommended. The aspirations of the venture include ensuring a constant supply of raw materials, having its own facilities, improving production processes, and extending the shelf life of the product without the use of chemical additives, thus consolidating its competitive advantage.
Finally, based on the interview with the representative of the venture, the expected results were defined, detailed in terms of the name of the indicator, the goal to be achieved, and the deadline for compliance, as presented in table 6.
Table 6. Matrix of indicators for results
Name |
Target |
Timeframe |
Labeling |
Implement 1,000 informational labels containing information on the benefits of consuming natural and nutritional products. |
6 months |
Storage |
Have five rooms suitable for storing raw materials. |
9 months |
Raw materials |
Have 30% of primary raw materials available through partnerships with local suppliers. |
1 year |
Training |
Schedule four training sessions for all staff, two on production processes and two on quality control. |
1 year |
Sales |
Increase sales by 30%. |
1 year |
Legal |
Obtain health registration and operating permit. |
1 year |
Expansion |
Expand coverage to three neighboring cantons. |
3 years |
Technology |
Implement a pulp extractor machine. |
3 years |
Export |
Expand delivery coverage to two countries. |
5 - 10 |
Quality |
Have a manual of procedures and processes for making chamburo preserves. |
5 - 10 |
Infrastructure |
Have a property owned by the association for the production and storage of the product. |
10 years |
Source: own elaboration based on primary information
Although quality management is widely recognized as a key factor in achieving competitiveness for SMEs' products, the literature review on the use of the Quality Function Deployment approach yielded few results, limiting the possibility of comparison and discussion with other authors.
However, points of agreement with previous studies have been identified, which indicate that a lack of experience and knowledge about the method hinders its application, as does the commitment of the organization's members, as it is perceived as a highly complex approach for this type of company (Zur et al., 2017). Despite this, in general terms, companies recognize the usefulness and benefits of qualitative methods for strengthening cross-functional communication and teamwork, as well as their contribution to improving product competitiveness by meeting customer requirements and reducing costs (Juniani et al., 2022; Reyna Tenorio et al., 2022). Likewise, a highly significant, positive, and strong correlation has been found between service quality, customer satisfaction, and customer loyalty (Silva Treviño et al., 2021).
The limited application of this approach can be attributed, to a large extent, to the complexity perceived by SMEs' managers, especially in rural contexts, which makes it necessary to seek advice from external agents for its proper implementation.
In line with the above, this study confirms the relevance of quality as a strategic factor for the competitiveness of small businesses, particularly in the face of structural barriers that hinder their positioning and sustainability in globalized markets. The implementation of the Quality House tool allows these organizations to design strategies aimed at improving their performance and achieving competitive differentiation.
Nutritional and sensory attributes, preservation and safety, and preparation and processing were identified as priority quality criteria. To meet these criteria, the most relevant quality requirements relate to quality control, regulatory compliance, and the availability of adequate assets, with investment in these areas being essential to raising product quality.
From the consumer's perspective, the association offers competitive advantages in nutritional and sensory attributes, as well as in preservation and safety, which can be leveraged as a differentiating factor. However, the product's positioning is still unclear, so it is recommended that an improvement plan be developed that includes effective communication of its natural and healthy attributes as the main differentiating factor.
Based on the above, it is suggested that a procedures manual be developed to standardize operations, improve efficiency, and facilitate staff training. It is also considered necessary to strengthen technical training processes, crop management, and the use of raw materials. Finally, obtaining health certifications will be key to building consumer confidence and facilitating access to new markets.
The findings of this research may be useful for other associations to evaluate the relevance of applying this tool, adapting it to their particular circumstances, which would allow them to identify opportunities for improvement that contribute to the positioning of their products in the market. However, the following questions are raised for future research, in order to continue studying this topic:
REFERENCES
Agencia Nacional de Regulación, Control y Vigilancia Sanitaria (ARCSA). (2024). Certificado Sanitario de Exportación de Alimentos | Ecuador-Guía Oficial de Trámites y Servicios. https://www.gob.ec/arcsa/tramites/certificado-sanitario-exportacion-alimentos
Akao, Y. (2024). Quality Function Deployment: Integrating Customer Requirements into Product Design. CRC Press.
Alexander, P., Antony, J., & Rodgers, B. (2019). Lean Six Sigma for small- and medium-sized manufacturing enterprises: A systematic review. International Journal of Quality & Reliability Management, 36(3), 378-397. https://doi.org/10.1108/IJQRM-03-2018-0074
Banco Mundial. (2024). World Development Report 2024: The Middle-Income Trap. Banco Mundial. https://www.worldbank.org/en/publication/wdr2024
Carrero, L., Brayan, G., Velásquez, P., & Santis, A. (2021). Design of a Strategy for the Quality Management System in a Bricks Manufacturing Company in Colombia. Chemical Engineering Transactions, 86, 643-648. https://doi.org/10.3303/CET2186108
Defeo, J. A. (2023). Juran's Quality Handbook (7.a ed.). McGraw-Hill Education.
Deming, W. E. (2000). Out of the Crisis. MIT Press.
GEM. (2024). GEM 2023/2024 Global Report: 25 Years and Growing. Global Entrepreneurship Monitor. https://www.gemconsortium.org/report/global-entrepreneurship-monitor-gem-20232024-global-report-25-years-and-growing
ISO. (2015). Sistemas de gestión de la calidad-Requisitos (No. ISO 9001:2015). Organización Internacional de Normalización. https://www.iso.org/obp/ui#iso:std:iso:9001:ed-5:v1:es
ISO. (2018). Sistemas de gestión de la inocuidad de los alimentos-Requisitos para cualquier organización en la cadena alimentaria (No. ISO 9000:2015). Organización Internacional de Normalización. https://www.iso.org/obp/ui#iso:std:iso:22000:ed-2:v2:es
Juniani, A. I., Singgih, M. L., & Karningsih, P. D. (2022). Design for Manufacturing, Assembly, and Reliability: An Integrated Framework for Product Redesign and Innovation. Designs, 6(5), 88. https://doi.org/10.3390/designs6050088
Ledesma Munive, M. A. (2024). Enhancing competitiveness of Peruvian textile mses through quality management: A focus on leadership, training, and continuous improvement. Jurnal Ilmiah Ilmu Terapan Universitas Jambi, 8(2), 666-677. https://doi.org/10.22437/jiituj.v8i2.33967
Martínez Paz, J. M., Martínez Carrasco Pleite, F., & Dios Palomares, R. (2005). La industria de conservas vegetales de la región de Murcia: Análisis de eficiencia técnica. Revista de estudios regionales, 0(73), 141-158. http://www.revistaestudiosregionales.com/documentos/articulos/pdf820.pdf
Medina Albaladejo, F. J. (2010). External competitiveness of Spanish canned fruit and vegetable businesses during the second half of the twentieth century. Business History, 52(3), 417-434. https://doi.org/10.1080/00076791003721845
Müller, C., & Lucero Bringas, M. de los Á. (2024). Heritage and Legacy in Small Family Firms in Latin America. Journal of Evolutionary Studies in Business, 9(1), 1-8. https://doi.org/10.1344/jesb2024.9.1.43712
OECD, CAF, & SELA. (2024). Índice de Políticas para PyMEs: América Latina y el Caribe 2024: Hacia una recuperación inclusiva, resiliente y sostenible. OECD Publishing. https://doi.org/10.1787/807e9eaf-es
Reyna Tenorio, L. J., Ulloa de Souza, R. C., & Chere Quiñónez, B. F. (2022). Implementación de modelos de calidad en pequeñas y medianas empresas del sector industrial del Ecuador. Sapienza: International Journal of Interdisciplinary Studies, 3(7), 124-138. https://doi.org/10.51798/sijis.v3i7.520
Rigatto, P., Padula, A. D., & Larson, D. W. (2005). Differences between supply-chain structures within a given industry: Insights from the Brazilian peach canning industry. International Journal of Logistics Systems and Management, 1(4), 311. https://doi.org/10.1504/IJLSM.2005.006236
Ruiz-Falcó Rojas, A. (2009). Despliegue de la función calidad (QFD). Universidad Pontificia Comillas. https://web.cortland.edu/matresearch/qfd.pdf
Silva Treviño, J. G., Macías Hernández, B. A., Tello Leal, E., & Delgado Rivas, J. G. (2021). La relación entre la calidad en el servicio, satisfacción del cliente y lealtad del cliente: Un estudio de caso de una empresa comercial en México. CienciaUAT, 15(2), 85-101. https://doi.org/10.29059/cienciauat.v15i2.1369
Wyrwa, D., & Ziółkowski, B. (2015). Quality management systems in competitive strategies of Polish enterprises. En Production Management and Engineering Sciences: Proceedings of the International Conference on Engineering Science and Production Management (ESPM 2015), Tatranská Štrba, High Tatras Mountains, Slovak Republic, 16th-17th April 2015 (pp. 327-332). CRC Press.
Zur, R., Alwiah, Sahil. S. S., Syaimak, A. S., & Legino, R. (2017). The Readiness of Quality Function Deployment Theory Implementation Among the SME Apparel in Malaysia: A Review. Advanced Science Letters, 23(4), 3194-3197. https://doi.org/10.1166/asl.2017.7708
Conflict of interest
Authors declare that they have no conflicts of interest.
Authors' contribution
All the authors reviewed the writing of the manuscript and approve the version finally submitted.
