 0009-0009-2292-5817
  dm_sanchez91@hotmail.com
Marco Vinicio Quito Carrión1
0009-0000-4919-0456 marco.quito.carrion@gmail.comAngie Fernández Lorenzo1
0000-0001-6106-8576 angie821218@gmail.com
Cooperativismo y Desarrollo, May-August 2025; 13(2), e885
Translated from the original in Spanish
Original article
Workplace diversity and innovation capacity in Ecuadorian mass consumption companies
Diversidad de los equipos y capacidad de innovación en empresas ecuatorianas de consumo masivo
Diversidade das equipes e capacidade de inovação em empresas equatorianas de grande consumo
Diana Mercedes Sánchez Huachi1 0009-0009-2292-5817 dm_sanchez91@hotmail.com
Marco Vinicio Quito Carrión1 0009-0000-4919-0456 marco.quito.carrion@gmail.com
Angie Fernández Lorenzo1 0000-0001-6106-8576 angie821218@gmail.com
1 University of the Armed Forces - ESPE. Ecuador.
Received: 20/03/2025
Accepted: 9/06/2025
ABSTRACT
In Ecuador, the inclusion of a diverse workforce is mandatory by agreement of the Ministry of Labor. Although initially companies made it a mandatory task, there is now theoretical and practical evidence that the integration of heterogeneous groups provides multiple perspectives and facilitates innovative solutions. However, other studies warn that labor diversity must be properly managed because it is possible to generate a counterproductive effect, transforming differences into sources of conflict rather than opportunities for innovation. Using descriptive statistics and factor analysis, we sought to identify the influence of labor diversity on the innovation capacity of two mass consumption companies located in the industrial sector of the city of Quito. With the demographic data collected, it was identified that the greatest diversity present in both companies is the diversity of work experience. Additionally, it was identified that in both companies, age and gender diversity had the greatest influence on innovation capacity. This study demonstrated the importance of policies that promote diversity not only as compliance with regulations, but also as a strategy to boost innovation and competitiveness in the industrial sector.
Keywords: labor diversity; factor analysis; innovation capacity; mass consumption sector.
RESUMEN
En Ecuador es obligatorio la inclusión de una fuerza laboral diversa mediante acuerdo del Ministerio de Trabajo. Si bien inicialmente las empresas lo realizaban como una tarea obligatoria, actualmente se tiene evidencia teórica y práctica de que la integración de grupos heterogéneos aporta múltiples perspectivas, lo que facilita soluciones innovadoras. No obstante, otros estudios advierten que la diversidad laboral debe ser gestionada adecuadamente pues es posible generar un efecto contraproducente, transformando las diferencias en fuentes de conflicto, más que en oportunidades de innovación. Con el empleo de estadística descriptiva y análisis factorial, se buscó identificar la influencia de la diversidad laboral en la capacidad de innovación de dos empresas de consumo masivo, localizadas en el sector industrial de la ciudad de Quito. Con los datos demográficos recopilados se identificó que la mayor diversidad presente en ambas empresas es la diversidad de experiencia laboral. Adicionalmente, se identificó que en ambas empresas la diversidad de edad y género presenta la mayor influencia en la capacidad de innovación. Gracias a este estudio se comprobó la importancia de las políticas que promueven la diversidad no solo como un cumplimiento de la normativa, sino como una estrategia para impulsar la innovación y la competitividad en el sector industrial.
Palabras clave: diversidad laboral; análisis factorial; capacidad de innovación; sector de consumo masivo.
RESUMO
No Equador, a inclusão de uma força de trabalho diversificada é obrigatória por acordo do Ministério do Trabalho. Embora inicialmente as empresas o tenham tornado uma tarefa obrigatória, existem atualmente provas teóricas e práticas de que a integração de grupos heterogéneos traz múltiplas perspectivas e facilita soluções inovadoras. No entanto, outros estudos alertam para o facto de a diversidade no local de trabalho dever ser gerida de forma adequada, uma vez que pode ter um efeito contraproducente, transformando as diferenças em fontes de conflito e não em oportunidades de inovação. Através da estatística descritiva e da análise fatorial, procurou-se identificar a influência da diversidade laboral na capacidade de inovação em duas empresas de grande consumo localizadas no sector industrial da cidade de Quito. Com os dados demográficos recolhidos, identificou-se que a maior diversidade presente em ambas as empresas é a diversidade de experiência profissional. Além disso, identificou-se que, em ambas as empresas, a diversidade de idade e género teve a maior influência na capacidade de inovação. Este estudo demonstrou a importância de políticas que promovam a diversidade não apenas como cumprimento de regulamentos, mas também como estratégia para impulsionar a inovação e a competitividade no sector industrial.
Palavras-chave: diversidade laboral; análise fatorial; capacidade de inovação; setor de consumo de massa.
INTRODUCTION
In a world in which technological, social and economic changes occur at an accelerated pace, the capacity for innovation has become a critical factor for the survival and success of companies, especially in dynamic sectors such as mass consumption. In Ecuador, companies engaged in the manufacture and marketing of products for mass consumption face intense competition to capture consumer preference, which forces them to offer differentiated products adapted to market trends. As a result, diversity in the workplace is essential, since having various perspectives in work teams fosters creativity and effective innovation. Globally, qualitative (Bassett Jones, 2005; Oanh et al., 2020) and quantitative (Alshemmari & Al Monawer, 2024; Nham et al., 2020) studies have shown that workforce diversity can significantly improve the innovation capability of firms. However, these studies warn that inadequate diversity management can generate conflicts, considering that divergent criteria can hinder innovation. These studies have been developed at the corporate level, contemplating only the perspective and criteria of the top management of the companies without taking into consideration the opinion of the employees, so the present study is based on analyzing and interpreting the results obtained through the application of a questionnaire to employees of companies focused on mass consumption.
The term diversity covers a range of differences in nationality, gender, roles, functions, abilities, languages, religions, intellectual capacities, and lifestyles (Kossek & Lobel, 1996). According to Oyewunmi (2018), a major challenge of diverse workforce is the omission of certain individuals or groups due to differences such as gender, age, ethnicity or cultural affiliation, religion, social class, and disability.
Diversity can generate an ambivalent effect, at one extreme, authors such as Triana et al. (2014) emphasize that diversity in work teams will provide optimal results in team performance. While, at the other extreme, authors such as Daily and Dalton (2003) support that the same diversity can cause tensions and conflicts in work teams. Taking a neutral position, Horwitz and Horwitz (2007) indicate that diversity should be properly managed to avoid discrepancies and obtain the best results from work teams.
According to Rasool et al. (2019), workplace innovation is the process of introducing new ideas, ways and methods of working, productivity and improving overall performance. YuSheng and Ibrahim (2020) pointed out that workplace innovation is one of the most essential elements to ensure the success of organizations and increase their competitiveness, while Lee et al. (2019) found that innovation would help the organization to adapt to the volatile conditions of markets and work environments by creating new ideas to meet the needs of customers.
In business management, innovation is essential for business survival through the development of innovation capability (Oanh et al., 2020). The concepts of innovation capability are varied, but in synthesis they all maintain the same central idea. Lawson and Samson (2001) defined innovation capability as the ability to continuously transform knowledge and ideas into new products, processes and systems for the benefit of the company and its stakeholders. Innovation capability is also understood as the ability to continuously transfer knowledge and ideas to create new systems, processes and products that benefit firms and stakeholders (Oanh et al., 2020). It has been suggested that innovation capabilities are called higher-order capabilities or "the ability to shape and manage multiple capabilities" (Lawson & Samson, 2001). It is worth noting the importance of innovation capabilities as evidenced by Larios Francia and Ferasso (2023) in their study on how product and service innovation were of vital importance to small and medium-sized enterprises during the COVID-19 health emergency, as small and medium-sized enterprises that did not respond adequately had to close their operations.
Bassett Jones (2005) stressed that diversity in the workplace can be both a source of competitive advantage and a challenge for organizations. She highlighted the importance of managing diversity to leverage its benefits in terms of creativity, innovation and decision making, while considering possible negative impacts such as conflict, lack of cohesion and communication problems. In summary, she stressed the importance of finding a balance between the benefits and challenges of diversity in the workplace to achieve a sustainable competitive advantage.
There are several previous studies that have related diversity and innovation capacity. Quintana García and Benavides Velasco (2008) indicate that companies with diverse human capital among their employees are more likely to innovate, considering that different points of view, educational profiles and experience facilitate the resolution of complex problems. In the study conducted by Parrotta et al. (2014), they found that labor diversity, measured in terms of cultural, educational and demographic diversity, has a positive and significant effect on business innovation. Romero et al. (2017) studied the Spanish case of the effect between gender diversity and educational level on innovation and evidenced a positive relationship of these diversities with new product innovation. As a recent contribution, the study by Alshemmari and Al Monawer (2024) corroborates that proper diversity management in the workplace can create a positive work environment that fosters employee engagement, collaboration and innovation, which, in turn, can help organizations stay competitive and adapt to changing market conditions.
Whereas, although diversity in teams can have positive effects on innovative performance, too much heterogeneity could also be detrimental to team performance. Therefore, while diversity can be a valuable strategy for organizations in terms of providing increased cognitive capacity, it is important to consider that an appropriate balance of capabilities and skills in the team is crucial to benefit from creativity in diverse teams and avoid potential conflicts and mistrust, associated with diversity (García Martínez et al., 2017).
Two companies located in the industrial sector of Quito, Ecuador, were selected for the study. Company A, founded in 1998, specializes in the manufacture and marketing of sauces, dressings and condiments to restaurant/hotel chains. In 2020 it opened a new segment focused on the end consumer. Company B, established in 1989, is dedicated to the development of fragrances, flavors and fine perfumery, from 2021 it focused its efforts on offering its products to the end consumer, in 2023 it became multinational by opening its operation in Lima, Peru. Both companies have prioritized the expansion of their presence in the mass consumer segment, which has made it necessary to offer innovative products to capture consumer preference. In this context, the objective of this research focuses on analyzing the influence of team diversity on the innovation capacity of the aforementioned Ecuadorian mass consumption companies.
MATERIALS AND METHODS
This research was developed with a mixed approach and correlational scope. The study population is composed of 470 employees and workers of mass consumption companies, whose main headquarters are located in the province of Pichincha, Ecuador, comprised of 350 employees of company A and 120 employees of company B.
Using the finite sample estimation formula, the required sample was calculated with a confidence level of 99%, a probability of 0.5 of the event occurring and a maximum estimation error of 0.1. This resulted in the required sample for the present study being 112 surveys for company A and 70 surveys for company B. Through the application of the survey, results were obtained from 178 employees of company A and 80 employees of company B, which makes the sample obtained reliable as it is higher than the required sample. The surveys were collected by means of physical surveys for operational personnel and online surveys using Microsoft Forms for administrative personnel.
The questionnaire was developed based on the following instruments used in previous research:
The questionnaire was structured on a five-point Likert scale ranging from "Strongly disagree" to "Strongly agree". Prior to the implementation of the questionnaire, it was validated by seven national experts in the topics under study. A summary of the experts' information is presented in table 1.
Table 1. Experts participating in the validation of the questionnaire
Institution |
Academic level |
Occupation |
Years of experience |
University of the Armed Forces - ESPE |
PhD |
Teacher |
21 |
University of the Armed Forces - ESPE |
PhD |
Teacher |
16 |
University of the Armed Forces - ESPE |
PhD |
Teacher |
18 |
Universidad de las Américas - UDLA |
Master's degree |
Teacher |
14 |
International University of Ecuador - UIDE |
PhD |
Teacher |
14 |
Company A |
Master's degree |
Recruitment Coordinator |
7 |
Company B |
Master's degree |
Human Resources Manager |
11 |
Source: Prepared by the authors
Once the survey was validated by the experts, a 35-question questionnaire was obtained. The internal consistency of the questionnaire was determined by calculating Cronbach's Alpha, obtaining values of 0.975 for the results of company A and 0.978 for the results of company B. Considering that values above 0.9 indicate excellent internal consistency of a questionnaire, the study was continued. Descriptive statistics, correlation analysis and factor analysis were used to process the surveys using IBM SPSS Stadistics 30 and Microsoft Excel.
The coding used to simplify the data processing of the 35 questions of the questionnaire is presented in table 2. An alphanumeric combination was assigned for the variables of each question of the dimensions of labor diversity and innovativeness.
Table 2. Coding of variables of labor diversity and innovativeness
Dimension |
Variable |
Questions |
Age and gender diversity |
A1 |
Foster a collaborative and creative environment, eliminating stereotypes and promoting new ideas |
A2 |
Supports different caregiving responsibilities and balances my needs between work and personal life |
|
A3 |
Eliminates gender stereotypes and provides role models for younger employees and promotes an inclusive culture |
|
A4 |
Supports my professional development and that of my colleagues, regardless of age or gender |
|
Diversity of race and ethnicity |
B1 |
Respecting different races helps to better understand and serve employee needs |
B2 |
Embracing the symbols of diverse cultural traditions helps employees from different racial and ethnic backgrounds |
|
B3 |
Adopting inclusive hiring practices has an impact on attracting and retaining a wider variety of talent |
|
B4 |
Dealing with diverse suppliers and vendors shows that we value diversity and are committed to equity and inclusion throughout the supply chain |
|
Diversity of physical and mental ability |
C1 |
Diversity support helps create an accessible, inclusive and welcoming environment for employees with physical and mental disabilities |
C2 |
Assistive technology and tools are one way to support employees with physical and mental disabilities |
|
C3 |
Open communication makes people with physical and mental disabilities feel valued and appreciated |
|
C4 |
Disability awareness and education contributes to a more inclusive work culture, where functional diversity is seen as a strength |
|
Diversity of education and work experience |
D1 |
Valuing unique skills and experiences creates a more diverse workforce? |
D2 |
Appreciating and promoting employees' diverse skills and experiences helps to support career advancement and foster an environment of continuous growth? |
|
D3 |
Being open to different experiences and skills means helping employees learn from each other |
|
D4 |
Embracing multiple skills and experiences enriches the organization's knowledge and skills |
|
Capacity for individual innovation |
W1 |
Enjoy trying new ideas |
W2 |
Having a strong desire for discovery that leads me to new ideas |
|
W3 |
Finding new ways of doing things |
|
W4 |
Often improvising methods to solve a problem when there is no obvious answer |
|
W5 |
Consider yourself creative and original in your thinking and behavior. |
|
W6 |
Being more creative through continuous learning in the organization |
|
Product innovation capacity |
X1 |
Frequently develops new products that are well accepted by the market |
X2 |
Often able to launch new products faster than our competitors |
|
X3 |
First to market new products |
|
X4 |
It has greater capacity in Research and Development of new products than our competitors. |
|
X5 |
New product introductions have increased over the last 5 years |
|
Process innovation capacity |
Y1 |
Always acquire new skills or equipment to improve the manufacturing operation or service process. |
Y2 |
Can develop more efficient manufacturing processes or operating procedures |
|
Y3 |
It is creative in its methods of operation |
|
Y4 |
Find new ways of doing things |
|
Capacity for managerial innovation |
Z1 |
Department heads adopt new leadership approaches to guide all staff toward task completion |
Z2 |
Emphasis is placed on innovative and creative capabilities in recruiting personnel |
|
Z3 |
Incentives are given to staff to generate new ideas and look for new ways of doing things |
|
Z4 |
The division of labor between the different departments is changed according to market management requirements |
Source: Prepared by the authors
Finally, to assess the levels of diversity in both companies, the Blau's Index was used, a tool commonly employed in empirical studies on organizational demographics, such as the work by Coba et al. (2022). This index is widely recognized for its ability to measure diversity within organizations, which makes it a suitable indicator for the analysis of labor diversity in the context of this study. Blau's Index is calculated by applying the following equation:
Where:
is the proportion of employees in the group
is the total number of groups in the category
RESULTS AND DISCUSSION
The results of the demographic data obtained from the application of the questionnaire in both companies are presented in table 3. The sample of the population selected for company A was mostly men (61 %), belonging to the Millenials generation (67 %), single (47 %), with High School as their level of academic preparation (61 %). For company B, the sample population was mostly men (61 %), belonging to the Millenials generation (57 %), of single marital status (50 %), with undergraduate degree as their level of academic preparation (50 %).
Table 3. General characterization of the sample
Socio-demographic information |
Company A |
Company B |
|
N = 178 |
N = 80 |
||
Age group |
|
|
|
|
Generation X (1965-1980) |
5 % |
13 % |
|
Millennials (1981-1996) |
67 % |
57 % |
|
Centennials (1997-2010) |
28 % |
30 % |
Genre |
|
|
|
|
Male |
61 % |
61 % |
|
Female |
39 % |
39 % |
|
Another |
0 % |
0 % |
|
I prefer not to answer |
0 % |
0 % |
Ethnicity |
|
|
|
|
Mestiza |
91 % |
94 % |
|
Montuvia |
5 % |
0 % |
|
Afro-Ecuadorian |
1 % |
1 % |
|
Indigenous |
1 % |
1 % |
|
White |
2 % |
4 % |
|
Other |
0 % |
0 % |
Religion |
|
|
|
|
Catholic |
75 % |
71 % |
|
Evangelical |
11 % |
9 % |
|
Jehovah's Witness |
13 % |
1 % |
|
Other |
1 % |
19 % |
Marital status |
|
|
|
|
Single |
47 % |
50 % |
|
Married |
29 % |
33 % |
|
Widower |
1 % |
1 % |
|
Divorced |
3 % |
5 % |
|
Free union |
20 % |
11 % |
Education level |
|
|
|
|
Basic general education |
3 % |
5 % |
|
Baccalaureate |
61 % |
32 % |
|
Undergraduate |
28 % |
50 % |
|
Postgraduate |
8 % |
13 % |
Income level |
|
|
|
|
$400 - $900 |
76 % |
77 % |
|
$901 - $1400 |
16 % |
15 % |
|
$1401 - $1900 |
4 % |
5 % |
|
> $1900 |
4 % |
3 % |
Years of experience in the company |
|
|
|
|
Less than 1 year |
19 % |
15 % |
|
Between 1 and 5 years |
48 % |
48 % |
|
Between 5 and 10 years |
17 % |
19 % |
|
Greater than 10 years |
16 % |
18 % |
Source: Prepared by the authors
In the table 4 the diversity indexes present in both companies are presented, for its calculation the Blau's Index was used. Comparing the results of both companies, there are similar values in terms of diversity indexes; however, for both companies, the indicator with the highest diversity is the work experience of their employees and the lowest is the diversity of race or ethnicity.
Table 4. Diversity indexes of the companies
Diversity in the workplace |
Blau's Index |
|
Company A |
Company B |
|
Age Group |
0,467 |
0,569 |
Genre |
0,475 |
0,475 |
Ethnicity |
0,168 |
0,143 |
Religion |
0,404 |
0,449 |
Marital status |
0,655 |
0,629 |
Education level |
0,539 |
0,629 |
Income level |
0,395 |
0,381 |
Years of experience in the company |
0,680 |
0,681 |
Source: Prepared by the authors
Theory indicates that there is a significant relationship between labor diversity and innovativeness in organizations. To explore this relationship in the context of the companies studied, exploratory factor analysis was applied to identify the constructs generated by the interaction between the factors of labor diversity and innovativeness.
The table 5 shows the result of the calculation of correlations, through Spearman's Rho test, between the 8 integrated factors of labor diversity and innovation capacity, presenting only the dimensions that have significant correlations of moderate or high order.
For company A the factors with a high positive significant correlation were:
For company B the factors with a high positive significant correlation were:
Table 5. Correlations between the Innovation and Labor diversity factors of both companies
Innovation - Dimension |
Labor diversity - Dimension |
Level of significance |
|
Company A |
Company B |
||
Capacity for individual innovation |
Age and gender diversity |
0,609** |
0,717** |
Diversity of race and ethnicity |
0,575** |
0,671** |
|
Diversity of physical and mental ability |
0,608** |
0,557** |
|
Diversity of education and work experience |
0,637** |
0,657** |
|
Product innovation capacity |
Age and gender diversity |
0,481** |
0,473** |
Diversity of race and ethnicity |
0,518** |
0,554** |
|
Diversity of physical and mental ability |
0,574** |
0,560** |
|
Diversity of education and work experience |
0,521** |
0,526** |
|
Process innovation capacity |
Age and gender diversity |
0,588** |
0,686** |
Diversity of race and ethnicity |
0,476** |
0,694** |
|
Diversity of physical and mental ability |
0,606** |
0,731** |
|
Diversity of education and work experience |
0,567** |
0,707** |
|
Capacity for managerial innovation |
Age and gender diversity |
0,606** |
0,767** |
Diversity of race and ethnicity |
0,423** |
0,667** |
|
Diversity of physical and mental ability |
0,508** |
0,686** |
|
Diversity of education and work experience |
0,436** |
0,653** |
|
Note: ** p < 0.01 (bilateral)
Source: Prepared by the authors
Factor analysis between the factors of labor diversity and innovation capacity
A correlation analysis was performed using Spearman's Rho coefficient for the 35 variables in the questionnaire, processing the data for each company independently. As a methodological criterion, those variables with correlations lower than 0.4 were eliminated for the subsequent factor analysis. Thus, in the case of company A, questions X1, X2, Y4, Z3, Z4 were discarded and 30 questions with correlations higher than 0.4 were extracted. For company B, questions X2, X4, X5, Z1 were discarded and 31 questions with correlations higher than 0.4 were extracted.
The determinant of the correlation matrix of the factor analysis was positive, different from zero, which indicates that there are strong relationships between the variables. The Kaiser-Meyer-Olkin coefficient presented a value of 0.939 for the case of company A and a value of 0.912 for the case of company B, this is favorable in terms of the feasibility of the components and a Bartlett's sphericity with a p-value<0.01, therefore, the null hypothesis (Ho) was rejected and, consequently, the elements are related to each other and the factorial analysis is adequate.
Principal component analysis was used as the extraction method, and the table 6 shows the variances calculated for the variables determined for both companies. For both companies, the first 5 components account for more than 75% of the accumulated variance.
Table 6. Total variance explained by variables Company A and Company B
|
Company A |
Company B |
||||
Component |
Total |
% variance |
Accumulated |
Total |
% variance |
Accumulated |
1 |
17,293 |
57,645 |
57,645 |
18,759 |
60,513 |
60,513 |
2 |
1,753 |
5,844 |
63,489 |
2,111 |
6,808 |
67,321 |
3 |
1,368 |
4,559 |
68,047 |
1,382 |
4,458 |
71,78 |
4 |
1,256 |
4,188 |
72,235 |
1,078 |
3,476 |
75,256 |
5 |
1,11 |
3,7 |
75,935 |
1,053 |
3,396 |
78,651 |
6 |
0,848 |
2,828 |
78,763 |
0,875 |
2,823 |
81,474 |
7 |
0,712 |
2,373 |
81,137 |
0,703 |
2,268 |
83,742 |
8 |
0,562 |
1,872 |
83,009 |
0,601 |
1,94 |
85,683 |
9 |
0,508 |
1,692 |
84,701 |
0,522 |
1,685 |
87,368 |
10 |
0,467 |
1,558 |
86,259 |
0,501 |
1,617 |
88,985 |
11 |
0,425 |
1,418 |
87,678 |
0,418 |
1,348 |
90,333 |
12 |
0,401 |
1,335 |
89,013 |
0,399 |
1,286 |
91,619 |
13 |
0,376 |
1,253 |
90,266 |
0,361 |
1,165 |
92,783 |
14 |
0,355 |
1,183 |
91,449 |
0,287 |
0,926 |
93,71 |
15 |
0,313 |
1,045 |
92,494 |
0,27 |
0,869 |
94,579 |
16 |
0,298 |
0,992 |
93,486 |
0,26 |
0,839 |
95,419 |
17 |
0,246 |
0,819 |
94,304 |
0,215 |
0,694 |
96,113 |
18 |
0,231 |
0,77 |
95,075 |
0,186 |
0,601 |
96,714 |
19 |
0,206 |
0,688 |
95,762 |
0,171 |
0,553 |
97,266 |
20 |
0,185 |
0,615 |
96,378 |
0,132 |
0,426 |
97,692 |
21 |
0,177 |
0,591 |
96,968 |
0,117 |
0,377 |
98,069 |
22 |
0,147 |
0,49 |
97,458 |
0,1 |
0,321 |
98,391 |
23 |
0,131 |
0,436 |
97,894 |
0,088 |
0,284 |
98,675 |
24 |
0,122 |
0,407 |
98,301 |
0,085 |
0,276 |
98,951 |
25 |
0,113 |
0,376 |
98,677 |
0,078 |
0,252 |
99,203 |
26 |
0,095 |
0,317 |
98,994 |
0,056 |
0,182 |
99,385 |
27 |
0,093 |
0,309 |
99,304 |
0,055 |
0,178 |
99,563 |
28 |
0,084 |
0,279 |
99,582 |
0,042 |
0,135 |
99,698 |
29 |
0,074 |
0,246 |
99,829 |
0,036 |
0,115 |
99,814 |
30 |
0,051 |
0,171 |
100 |
0,03 |
0,097 |
99,911 |
31 |
|
|
|
0,028 |
0,089 |
100 |
Source: Prepared by the authors
Figures 1 and 2 show that, from the fifth component onwards, the selfvalue is less than 1 and the variance contribution tends to stabilize at a constant value. For company A and company B, this behavior is similar and suggests that the first 5 components contain the most significant correlations between labor diversity and innovativeness.
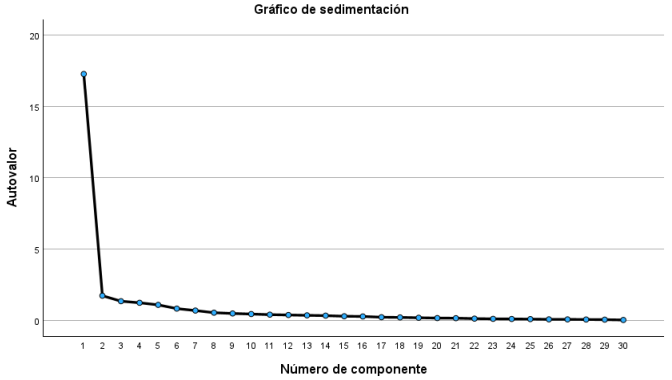
Figure 1. Sedimentation graph and suggested relationship components Company A
Source: Prepared by the authors
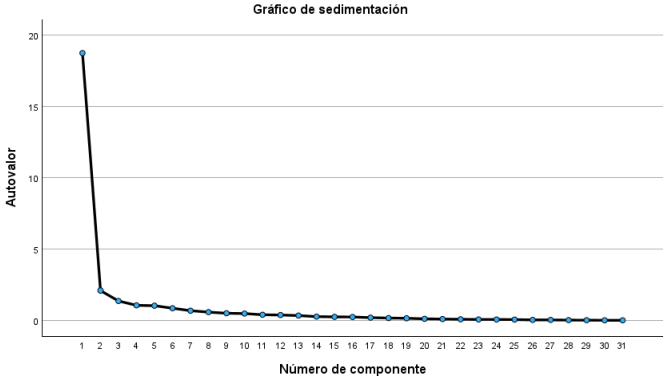
Figure 2. Sedimentation graph and suggested relationship components Company B
Source: Prepared by the authors
A rotated component matrix analysis was performed for the data obtained from the questionnaires applied to both companies. In both cases, five principal components were obtained, using the Varimax rotation method with Kaiser normalization. The results of this analysis are presented in table 7.
Table 7. Component analysis matrix Company A and Company B
Company A |
Company B |
||||||||||
Variable |
Component |
Variable |
Component |
||||||||
1 |
2 |
3 |
4 |
5 |
1 |
2 |
3 |
4 |
5 |
||
W4 |
0,74 |
0,25 |
0,23 |
0,18 |
0,18 |
D4 |
0,77 |
0,30 |
0,24 |
0,25 |
0,22 |
W3 |
0,73 |
0,32 |
0,32 |
0,21 |
0,17 |
D1 |
0,76 |
0,29 |
0,32 |
0,15 |
0,27 |
W2 |
0,73 |
0,20 |
0,32 |
0,21 |
0,20 |
B3 |
0,75 |
0,19 |
0,31 |
0,40 |
0,14 |
W6 |
0,71 |
0,25 |
0,36 |
0,35 |
0,17 |
B4 |
0,74 |
0,29 |
0,19 |
0,37 |
0,21 |
W1 |
0,68 |
0,20 |
0,28 |
0,22 |
0,39 |
B2 |
0,65 |
0,02 |
0,53 |
0,22 |
0,20 |
W5 |
0,63 |
0,26 |
0,21 |
0,41 |
0,25 |
X1 |
0,60 |
0,45 |
-0,03 |
0,11 |
0,50 |
A2 |
0,44 |
0,32 |
0,40 |
0,25 |
0,28 |
A1 |
0,60 |
0,35 |
0,15 |
0,39 |
0,03 |
B2 |
0,23 |
0,81 |
0,22 |
0,22 |
0,17 |
Z4 |
0,59 |
0,28 |
0,35 |
0,22 |
0,12 |
B4 |
0,18 |
0,81 |
0,26 |
0,26 |
0,14 |
W4 |
0,24 |
0,79 |
0,11 |
0,18 |
0,09 |
B1 |
0,27 |
0,79 |
0,25 |
0,10 |
0,16 |
W3 |
0,33 |
0,74 |
0,34 |
0,22 |
0,18 |
B3 |
0,29 |
0,62 |
0,30 |
0,14 |
0,18 |
W2 |
0,27 |
0,73 |
0,38 |
0,20 |
0,23 |
C1 |
0,45 |
0,56 |
0,36 |
0,16 |
0,32 |
W1 |
0,23 |
0,73 |
0,27 |
0,06 |
0,37 |
X5 |
0,49 |
0,50 |
0,15 |
0,33 |
0,15 |
A3 |
0,18 |
0,66 |
0,42 |
0,34 |
0,18 |
D2 |
0,36 |
0,30 |
0,77 |
0,15 |
0,21 |
W6 |
0,24 |
0,65 |
0,39 |
0,11 |
0,37 |
D1 |
0,39 |
0,26 |
0,75 |
0,17 |
0,19 |
Y1 |
0,09 |
0,58 |
0,29 |
0,39 |
0,45 |
D3 |
0,48 |
0,29 |
0,70 |
0,16 |
0,14 |
Z3 |
0,14 |
0,28 |
0,73 |
0,25 |
0,21 |
D4 |
0,38 |
0,32 |
0,70 |
0,21 |
0,18 |
W5 |
0,28 |
0,42 |
0,73 |
-0,02 |
0,19 |
C3 |
0,11 |
0,52 |
0,62 |
0,31 |
0,29 |
A2 |
0,37 |
0,39 |
0,66 |
0,16 |
0,07 |
C4 |
-0,01 |
0,36 |
0,55 |
0,43 |
0,47 |
D2 |
0,27 |
0,28 |
0,63 |
0,41 |
0,08 |
C2 |
0,24 |
0,46 |
0,50 |
0,32 |
0,30 |
A4 |
0,47 |
0,17 |
0,59 |
0,39 |
0,22 |
X4 |
0,21 |
0,19 |
0,18 |
0,81 |
0,27 |
D3 |
0,39 |
0,42 |
0,54 |
0,27 |
0,07 |
Y3 |
0,29 |
0,07 |
0,30 |
0,71 |
0,35 |
Y2 |
0,30 |
0,25 |
0,47 |
0,44 |
0,46 |
X3 |
0,34 |
0,36 |
0,09 |
0,69 |
-0,01 |
C3 |
0,45 |
0,19 |
0,25 |
0,72 |
0,23 |
Y1 |
0,53 |
0,23 |
0,31 |
0,55 |
0,18 |
C4 |
0,55 |
0,13 |
0,24 |
0,67 |
0,24 |
Y2 |
0,50 |
0,27 |
0,26 |
0,51 |
0,20 |
C2 |
0,42 |
0,12 |
0,18 |
0,67 |
0,37 |
A3 |
0,11 |
0,22 |
0,29 |
0,18 |
0,74 |
C1 |
0,49 |
0,37 |
0,13 |
0,65 |
0,04 |
Z1 |
0,42 |
0,08 |
0,05 |
0,22 |
0,66 |
Z2 |
0,08 |
0,38 |
0,45 |
0,54 |
0,20 |
A4 |
0,14 |
0,16 |
0,36 |
0,24 |
0,64 |
B1 |
0,37 |
0,44 |
0,42 |
0,44 |
0,04 |
Z2 |
0,56 |
0,18 |
0,01 |
0,12 |
0,64 |
X3 |
0,13 |
0,32 |
0,07 |
0,22 |
0,78 |
A1 |
0,38 |
0,41 |
0,21 |
0,00 |
0,53 |
Y3 |
0,47 |
0,17 |
0,43 |
0,25 |
0,62 |
|
Y4 |
0,45 |
0,28 |
0,36 |
0,13 |
0,61 |
|||||
Source: Prepared by the authors
Based on the interpretation of the results presented in table 7, the constructs of company A were elaborated on the basis of the questions, discarding the constructs formed by variables of the same dimension, for the other cases they were grouped based on positive correlation values with values between 0.44 and 0.81. As a result of this analysis, the final constructs were established, which are presented in detail in the table 8, providing a clear and well-founded structure for the research.
Table 8. Elaboration of constructs Company A
Component |
Construct |
Variables |
1 |
Individual innovation and work-life balance |
W4, W3, W2, W6, W1, W5, A2 |
2 |
Cultural diversity, inclusion and impact on innovation |
B2, B4, B1, B3, C1, X5 |
3 |
The construct was not analyzed because it consists only of items of the same dimension |
D2, D1, D3, D4, C3, C4, C2 |
4 |
The construct was not analyzed because it consists only of items of the same dimension |
X4, Y3, X3, Y1, Y2 |
5 |
Gender inclusion and innovative leadership |
A3, Z1, A4, Z2, A1 |
Source: Prepared by the authors
With the interpretation of the results of table 7, the constructs of company B were elaborated based on the questions, discarding the constructs formed by variables of the same dimension, for the other cases they were grouped on the basis of positive correlation values with values between 0.44 and 0.79. Thus, the constructs generated are presented in table 9.
Table 9. Elaboration of constructs Company B
Component |
Construct |
Variables |
1 |
Comprehensive diversity and innovative management |
D4, D1, B3, B4, B2, X1, A1, A1, Z4 |
2 |
Dynamic innovation from age and gender diversity |
W4, W3, W2, W1, A3, W6, Y1 |
3 |
Multilevel innovation for functional diversity |
Z3, W5, A2, D2, A4, D3, Y2 |
4 |
Management innovation based on human diversity |
C3, C4, C2, C1, Z2, B1 |
5 |
The construct was not analyzed because it consists only of items of the same dimension |
X3, Y3, Y4 |
Source: Prepared by the authors
Construct analysis
First, the constructs elaborated for company A were analyzed, in which it is evident that age and gender diversity has the greatest influence with respect to innovation, since it influences two of the three constructs elaborated.
The Individual innovation and Work-Personal Balance construct is valuable to the company as it demonstrates how the proportionate work-life balance positively influences employees' ability to generate creative ideas and innovative solutions.
The Cultural diversity, Inclusion and Innovation Impact construct reflects how various diversities, in this case, racial diversity and diversity of physical and mental abilities can influence a company's ability to innovate products. This demonstrates the benefit to the company of practices such as inclusive hiring, valuing diversity in the supply chain and supporting an accessible environment for employees with physical and mental disabilities.
The Gender inclusion and innovative leadership construct combines gender diversity (A3, A4, A1) with innovative leadership practices that foster inclusion and equity. Leaders who take a transformational approach (Z1, Z2) inspire employees to overcome gender stereotypes and actively contribute to the innovation process. This construct is intrinsically linked to idealized influence and inspirational motivation, where leaders act as role models and motivate employees to reach their full potential, regardless of their gender.
Finally, in the constructs elaborated for Company B, it is evident that age and gender diversity has the greatest influence with respect to innovation, given that it influences three of the four constructs elaborated.
The Integral diversity and innovative management construct show how the combination of multiple dimensions of diversity (D4, D1), (B3, B4, B2) and (A1), together with management that adapts to market needs (Z4), fosters an environment conducive to innovation. Valuing unique skills, respecting different cultures and eliminating gender stereotypes creates an organizational climate where employees are motivated to contribute new ideas and creative solutions.
The construct Dynamic innovation from age and gender diversity groups items related to individual innovation (W4, W3, W2, W1, W6), gender diversity (A3) and process innovation (Y1). It highlights how age and gender diversity enriches employees' ability to generate new ideas and improve operational processes. Eliminating gender stereotypes and supporting role models for younger employees fosters a dynamic and collaborative environment, where individual creativity translates into concrete improvements for the organization.
The Multilevel innovation by Functional Diversity construct integrates factors of individual innovation (W5), gender diversity (A2, A4), education and experience diversity (D2, D3) and process innovation (Y2). This construct evidences how functional diversity, from unique skills to varied work experiences, drives innovation at multiple levels of the organization. Valuing these differences and fostering an environment where employees can share knowledge and learn from each other contributes to an organizational climate that promotes creativity and continuous improvement.
The Management innovation from Human Diversity construct groups items related to diversity of physical and mental abilities (C3, C4, C2, C1), inclusive leadership (Z2) and racial diversity (B1). It reflects how creating an accessible and inclusive environment for people with disabilities, along with respect for different races, fosters an organizational climate where all employees feel valued and safe to contribute innovative ideas. Promoting awareness and education about functional and cultural diversity becomes a pillar for innovation in the organization.
The results of this study confirm that diversity in work teams, in terms of age and gender, has the greatest influence on innovation capacity, followed by diversity of education and work experience for the Ecuadorian companies analyzed. The evidence supports the idea that effective diversity management can enhance creativity and facilitate the generation of new ideas. In particular, age and gender diversity are associated with greater stimulus to creativity, while diversity in work experience contributes to complex problem solving and the optimization of organizational processes.
From a practical perspective, these results have relevant implications for mass consumption companies in Ecuador. The adoption of diversity policies that promote the inclusion of different age groups, gender and professional backgrounds may represent a key strategy to optimize innovation and improve competitiveness in globalized markets. Among the recommended actions is the implementation of intergenerational mentoring programs to facilitate the transfer of knowledge, as well as the development of gender-focused development plans to increase women's participation in decision-making positions, recognizing their impact on innovation processes.
For future research, it is recommended to extend the analysis to other industrial sectors, such as technology or finance, to assess the applicability of these findings. In addition, longitudinal studies could provide a deeper insight into the impact of diversity on innovation over time, especially in scenarios of economic or social change. Finally, Ecuadorian companies are urged not only to comply with diversity regulations, but also to adopt proactive strategies that foster an inclusive environment. This can be achieved through the creation of diversity committees, the implementation of training programs on inclusion and the strengthening of an organizational culture that values and takes advantage of individual differences as a source of innovation.
REFERENCES
Alshemmari, J. M. H. J., & Al Monawer, F. H. (2024). Analyzing The Relationship Between Workplace Diversity and Innovation and Its Influence on Organizational Performance. Journal of System and Management Sciences, 14(1), 471-489. https://doi.org/10.33168/JSMS.2024.0127
Bassett Jones, N. (2005). The Paradox of Diversity Management, Creativity and Innovation. Creativity and Innovation Management, 14(2), 169-175. https://doi.org/10.1111/j.1467-8691.00337.x
Coba, E., Díaz Córdova, J., Carrion Gavilanes, G., & Chango Casanova, D. (2022). La diversidad de género y el rendimiento en el sector financiero ecuatoriano. Revista Finanzas y Política Económica, 14(2), 561-586. https://doi.org/10.14718/revfinanzpolitecon.v14.n2.2022.10
Daily, C. M., & Dalton, D. R. (2003). Women in the boardroom: A business imperative. Journal of Business Strategy, 24(5). https://doi.org/10.1108/jbs.2003.28824eaf.002
García Martínez, M., Zouaghi, F., & García Marco, T. (2017). Diversity is strategy: The effect of R&D team diversity on innovative performance. R&D Management, 47(2), 311-329. https://doi.org/10.1111/radm.12244
Horwitz, S. K., & Horwitz, I. B. (2007). The Effects of Team Diversity on Team Outcomes: A Meta-Analytic Review of Team Demography. Journal of Management, 33(6), 987-1015. https://doi.org/10.1177/0149206307308587
Kossek, E. E., & Lobel, S. A. (Eds.). (1996). Managing Diversity: Human Resource Strategies for Transforming the Workplace. Blackwell Publishers.
Larios Francia, R. P., & Ferasso, M. (2023). The relationship between innovation and performance in MSMEs: The case of the wearing apparel sector in emerging countries. Journal of Open Innovation: Technology, Market, and Complexity, 9(1), 100018. https://doi.org/10.1016/j.joitmc.2023.100018
Lawson, B., & Samson, D. (2001). Developing Innovation Capability In Organisations: A Dynamic Capabilities Approach. International Journal of Innovation Management, 05(03), 377-400. https://doi.org/10.1142/S1363919601000427
Lee, R., Lee, J.-H., & Garrett, T. C. (2019). Synergy effects of innovation on firm performance. Journal of Business Research, 99, 507-515. https://doi.org/10.1016/j.jbusres.2017.08.032
Nham, T. P., Nguyen, T.-M., Tran, N. H., & Nguyen, H. A. (2020). Knowledge sharing and innovation capability at both individual and organizational levels: An empirical study from Vietnam's telecommunication companies. Management & Marketing. Challenges for the Knowledge Society, 15(2), 275-301. https://doi.org/10.2478/mmcks-2020-0017
Oanh, T. H., Thanh, D. N., & Hai, T. T. B. (2020). Innovative capacity in Micro, Small and Medium Enterprises: Review of international articles on empirical research. HCMCOUJS - Economics and Business Administration, 10(2), 146-154. https://doi.org/10.46223/HCMCOUJS.econ.en.10.2.585.2020
Oyewunmi, A. E. (2018). Normalizing difference: Emotional intelligence and diversity management competence in healthcare managers. Intangible Capital, 14(3), 429-444. https://doi.org/10.3926/ic.1050
Parrotta, P., Pozzoli, D., & Pytlikova, M. (2014). The nexus between labor diversity and firm's innovation. Journal of Population Economics, 27(2), 303-364. https://doi.org/10.1007/s00148-013-0491-7
Quintana García, C., & Benavides Velasco, C. A. (2008). Innovative competence, exploration and exploitation: The influence of technological diversification. Research Policy, 37(3), 492-507. https://doi.org/10.1016/j.respol.2007.12.002
Rasool, S. F., Samma, M., Wang, M., Zhao, Y., & Zhang, Y. (2019). How Human Resource Management Practices Translate Into Sustainable Organizational Performance: The Mediating Role Of Product, Process And Knowledge Innovation. Psychology Research and Behavior Management, Volume 12, 1009-1025. https://doi.org/10.2147/PRBM.S204662
Romero Martínez, A. M., Montoro Sánchez, Á., & Garavito Hernández, Y. (2017). El efecto de la diversidad de género y el nivel educativo en la innovación. Revista de Administração de Empresas, 57(2), 123-134. https://doi.org/10.1590/s0034-759020170202
Triana, M. del C., Miller, T. L., & Trzebiatowski, T. M. (2014). The Double-Edged Nature of Board Gender Diversity: Diversity, Firm Performance, and the Power of Women Directors as Predictors of Strategic Change. Organization Science, 25(2), 609-632. https://doi.org/10.1287/orsc.2013.0842
YuSheng, K., & Ibrahim, M. (2020). Innovation Capabilities, Innovation Types, and Firm Performance: Evidence from the Banking Sector of Ghana. Sage Open, 10(2), 2158244020920892. https://doi.org/10.1177/2158244020920892
Conflict of interest
Authors declare no conflict of interests.
Authors' contribution
Diana Mercedes Sánchez Huachi and Marco Vinicio Quito Carrión participated in the theoretical and methodological structure, data collection, analysis and writing.
Angie Fernández Lorenzo directed the work, provided methodological guidance and participated in the revision of the data analysis and writing.
The three authors approved the version finally submitted to the journal.
