
Cooperativismo y Desarrollo, January-April 2020; 8(1), 68-82
Translated from the original in Spanish
Composite indicator through multivariate analysis of variance applied to the tourism sector
Indicador sintético mediante el análisis multivariado de la varianza aplicado al sector turístico
Indicador sintético através da análise multivariada da variância aplicada ao sector do turismo
Reinier Fernández López1, José Alberto Vilalta Alonso2, Arely Quintero Silverio3, Rebeca María Chávez Gomis4
1Universidad de Pinar del Río "Hermanos Saíz Montes de Oca". Facultad de Ciencias
Técnicas. Departamento de Matemática. Pinar del Río. Cuba. ORCID:
https://orcid.org/0000-0003-1974-9209. Email: rflopez@upr.edu.cu
2Universidad Tecnológica de La Habana (CUJAE). La Habana. Cuba. ORCID:
https://orcid.org/0000-0001-7505-8918. Email: jvilalta@ind.cujae.edu.cu
3Universidad de Pinar del Río "Hermanos Saíz Montes de Oca". Facultad de Ciencias
Técnicas. Departamento de Matemática. Pinar del Río. Cuba. ORCID:
https://orcid.org/0000-0003-2951-8957. Email: arelys@upr.edu.cu
4Universidad de Pinar del Río "Hermanos Saíz Montes de Oca". Facultad de Ciencias
Técnicas. Departamento de Matemática. Pinar del Río. Cuba. ORCID: https://orcid.org/0000-0001-6854-7596. Email: rebeca.chavez@upr.edu.cu
Received: July 9th, 2019.
Accepted: January 10th, 2020.
ABSTRACT
At present, the process of measuring tourist indicators in Pinar del Río does not provide a
composite indicator that offers a value as a measure of aggregation of the behavior of tourism indicators, since
no procedure that considers several aspects simultaneously is used to obtain it; This causes the
decision-making process to be affected. In this sense, the present work consists in developing a composite indicator for
the different hotel chains through the use of Multivariate Analysis of Variance techniques, which allows
obtaining a global measure to establish a ranking that supports the decision-making process in the different
hotel chains in Pinar del Río. Statistical-mathematical methods were used, among others, in order to
construct composite indicators.
Keywords: bootstrap; composite indicator; MANOVA; tourism
RESUMEN
En la actualidad, el proceso de medición de indicadores turísticos de Pinar del Río no proporciona
un indicador sintético que ofrezca un valor como medida de agregación del comportamiento de los
indicadores de turismo, al no emplearse en su obtención procedimientos que consideren varios
aspectos simultáneamente; lo anterior provoca que el proceso de toma de decisiones se vea afectado. En
este sentido, el presente trabajo consiste en elaborar un indicador sintético para las distintas cadenas
hoteleras mediante el empleo de técnicas de Análisis Multivariante de la Varianza, que permita la obtención de
una medida global para establecer un ranking que sustente el proceso de toma de decisiones en las
distintas cadenas hoteleras de Pinar del Río. Se utilizó, entre otros, los métodos estadístico-matemáticos, con el
fin de construir los indicadores sintéticos.
Palabras clave: bootstrap; indicador sintético; MANOVA; turismo
RESUMO
Atualmente, o processo de medição de indicadores turísticos em Pinar del Río não fornece um
indicador sintético que ofereça um valor como medida agregadora do comportamento dos indicadores turísticos,
uma vez que procedimentos que consideram vários aspectos simultaneamente não são utilizados para os
obter; isto faz com que o processo de tomada de decisão seja afetado. Neste sentido, o presente
trabalho consiste na elaboração de um indicador sintético para as diferentes cadeias hoteleiras através do uso
de técnicas de Análise de Variância Multivariada, que permite obter uma medida global para estabelecer
um ranking que suporte o processo de tomada de decisão nas diferentes cadeias hoteleiras de Pinar del
Río. Foram utilizados métodos matemáticos-estatísticos, entre outros, a fim de construir os
indicadores sintéticos.
Palavras-chave: bootstrap; indicador sintético; MANOVA; turismo
INTRODUCTION
Multivariate analysis is a discipline that is difficult to define, although it generally
brings together various statistical techniques which, although many of them were devised by
authors who can be called classics, owe their rise and implementation to the dissemination of
statistical software and the growing demand for them required by the development of other
disciplines (Montanero Fernández, 2008).
That is why research has increasingly used the analysis of variance with several
dependent variables as a multivariate analysis technique in recent years. A typical approach has been
to perform the analysis of univariate variance for each of the dependent variables. However,
this presents the difficulty of type I error inflation (Camacho Rosales, 1990). The
multivariate analysis of variance (MANOVA) solves this situation and has global significance
techniques (Wilks' Lambda, Hotteling-Lawley's Trace, and Roy's Maximum Root).
MANOVA is a generalization of the analysis of univariate variance for the case of more
than one dependent variable (Ramos Alvarez, 2017). The aim is to contrast the significance of
one or more factors (independent variables) for the set of dependent variables. It is a
statistical method for simultaneously exploring the relationship among several categorical variables
and two or more measurable or metric dependent variables (Salgado Horta, 2006).
In the present work, the objective was set: to elaborate a composite indicator, through
the use of Multivariate Variance Analysis techniques for the different hotel chains in Pinar del Río.
The application of the MANOVA procedure becomes difficult if a suitable statistical program
is not available. For this reason, the statistical language R 3.5.3 and the software R
Studio 1.1.463 are used in this research as support for data processing.
MATERIALS AND METHODS
Empirical research methods were used, based on scientific observation and
documentary analysis, which allowed characterizing the current situation of measuring tourism indicators
in Pinar del Río. The interview technique was used to determine the hotel chains that
were included in the research and to obtain information about tourism indicators. Among
the mathematical statistical methods, multivariate analysis techniques such as MANOVA
were used. Bootstrap was also used as a tool, which allowed for transformations in the
variables that did not contemplate normality. Software R 3.5.3 and R Studio 1.1.463 were used
to process the data.
At the same time, the measurement method was used for the description and analysis of
the behavior of the indicators in each of the dimensions.
Theoretical methods were also used to review the development of the current
tourism management processes in Pinar del Río, based on the use of indicators. As a logical
method, modelling, for the construction of the functions that guarantee the preparation of the
new aggregation procedure. Analysis and synthesis operations were used through the study of
the aggregation procedures for the construction of synthetic indicators.
Multivariate analysis of variance: MANOVA
Like analysis of variance (ANOVA), analysis of multivariate variance (MANOVA) is designed
to assess the importance of group differences. The only substantial difference between the
two procedures is that MANOVA can include several dependent variables, while ANOVA can
only handle one (Cuadras, 2014).
Often, these dependent variables are just different measures of the same attribute, but this
is not always the case. At a minimum, the dependent variables should have some degree
of linearity and share a common conceptual meaning; they should make sense as a group
of variables. The basic logic behind a MANOVA is essentially the same as in a univariate
analysis of variance. The MANOVA also operates with a set of assumptions, as does the ANOVA,
which are (Avendaño Prieto et al., 2014):
1. The observations within each sample should be sampled at random and should
be independent of each other.
2. Observations of all dependent variables should follow a multivariate normal distribution
in each group.
3. The population covariance matrices for the dependent variables in each group should
be the same (this assumption is often referred to as the homogeneity of the
covariance matrix assumption or the homocedasticity assumption).
4. The relationships between all pairs of dependent variables for each cell in the
data matrix should be linear.
Clarifying that randomness must be guaranteed in the design, the random samples must
be predetermined by the researcher in advance, before applying any technique.
Starting from the conceptual bases, when the multivariate technique MANOVA is applied,
only one hypothesis is contrasted: that the means of the g groups are equal in the p
dependent variables, that the g vectors of group means (called centroids) are equal (Ramos
Álvarez, 2017).
Bootstrap methodology
The Bootstrap technique, proposed by Efron (1979), is based on repeatedly extracting
samples from a set of training data, adjusting the model of interest for each sample. These are
non-parametric methods, which do not require any assumptions about population distribution
(Gil Martínez, 2018).
The basic idea is that, if a random sample is taken x=(x1, x2, x3,…, xn) then the sample can
be used to obtain more samples. The procedure is a random resampling (with replacement) of
the original sample such that each xi point has an equal and independent chance of being
selected as an element of the new bootstrap sample, that is, P(x*= xi) = 1/n, i = 1,2,3,…, n of a distribution with a distribution function F(x). The whole process is an independent repetition
of sampling, until a large number of bootstrapped samples are obtained. Multiple statistics can
be calculated for each bootstrap sample and, therefore, their distributions can be
estimated (Ramirez et al., 2013).
The empirical distribution function F(x)n, is an estimator of F(x). It can be proved that F(x)n is a sufficient statistic of F(x); that is, all the information about F(x) contained in the
sample is also contained in F(x)n. Furthermore, F(x)n is itself the distribution function of a
random variable, namely the random variable that is uniformly distributed in the set x=(x1, x2, x3,…, xn), therefore, the empirical distribution function F(x)n, is the distribution function of X* (Gil Abreu, 2014).
It is known that the sum of n random variables, with uniform distribution, quickly
approaches the normal distribution (Solanas & Sierra, 1992). Therefore, in the absence of normality,
we can use a bootstrap algorithm to obtain B estimates of the mean, based on B samples
obtained by resampling over the original sample (Vallejo et al., 2010).
The bootstrap technique, in this research, is applied to estimate means, homogenize
variance and achieve the assumption of multivariate normality, treating the sample as a kind of
statistical universe. In this study, the algorithm proposed by Efron (1979) was implemented:
1. Given the sample size n, estimate  , where in this case, is the mean to
be estimated.
, where in this case, is the mean to
be estimated.
2. Generate B bootstrap samples of size n by sampling with replacement of the
original sample, assigning each time a probability P(x*= xi) = 1/n, i = 1,2,3,…, n and calculate the corresponding values: 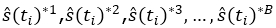 , for each of the B bootstrap samples.
3. Estimate the standard error of the estimated parameter , by calculating
the standard deviation of the B bootstrap replicates. Thus, we obtain that the
standard error is given by: 
Where  corresponds to the average of the estimate of the reliability function
evaluated at each time ti of the bootstrap sample; the procedure is performed based on the first
quartile time of interest (Ramírez Montoya et al., 2016).
corresponds to the average of the estimate of the reliability function
evaluated at each time ti of the bootstrap sample; the procedure is performed based on the first
quartile time of interest (Ramírez Montoya et al., 2016).
RESULTS AND DISCUSSION
The application of semi-structured interviews with the actors of the Ministry of Tourism,
in Pinar del Río (Mintur) determined the hotel chains or entities to be taken into consideration
in this research. The chains selected to establish the synthetic indicators were Cubanacán
Hotel Chain, Islazul Hotel Chain and Campismo Popular. From these entities, two indicators
were taken, one referring to efficiency: the cost per peso (cost/income) and the other referring
to effectiveness: income per tourist (income/quantity of tourists). These indicators allowed
the diagnosis of the studied entities, applying the MANOVA tool. The data taken includes
the values between January 2006 and December 2018.
From the analysis of the data through the cash flow graphs (Fig. 1), we can see the
existence of differences between the entities, with Campismo Popular being the least efficient, but
the most effective, while Cubanacán maintains low values of cost per peso and income
from tourists. Islazul shows similar cost per peso values as Cubanacán, although it exceeds it
in income/tourist, showing good management in terms of efficiency and effectiveness.
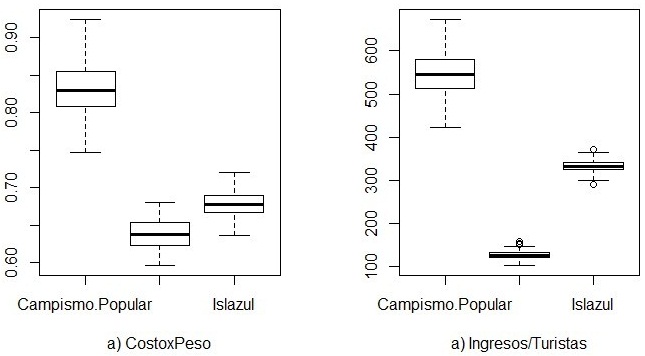
Fig. 1 - Box graphs for cost per peso and average income per tourist for each tourist entity
Source: R, version 3.5.3
Pearson's correlation coefficients between the dependent variables (cost per peso
and income per tourist), analyzed in the institution of Campismo and the Cubanacán and
Islazul Hotel Chains were -0.20436, -0.13801 and -0.29271 respectively, showing no
significant linear relationship between these variables (significance test with value p>0.05). This
result, however, is contrary to what would be expected as a result of good tourism management.
In figure 2, the above-mentioned can be seen.
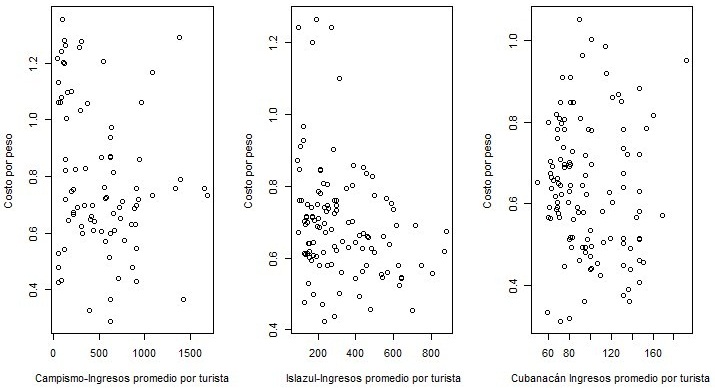
Fig. 2 - Graphs of dispersion cost per peso against average income per tourist for each
tourist entity
Source: R, version 3.5.3
When a significance test is performed for correlations between dependent variables, it
results in a probability value equal to 0.026 for the total data, rejecting the non-correlation hypothesis.
Figure 3 shows the graphs of dispersion with ellipses, by type of entity, which
provides information about the existence of problems with the assumption of constant
covariance matrices within the group (Fox et al., 2013).
The ellipses formed by the data of each entity contain notable differences in form, due to
the non-compliance with the assumption of equality of variances. This is usually due to
the absence of normality.
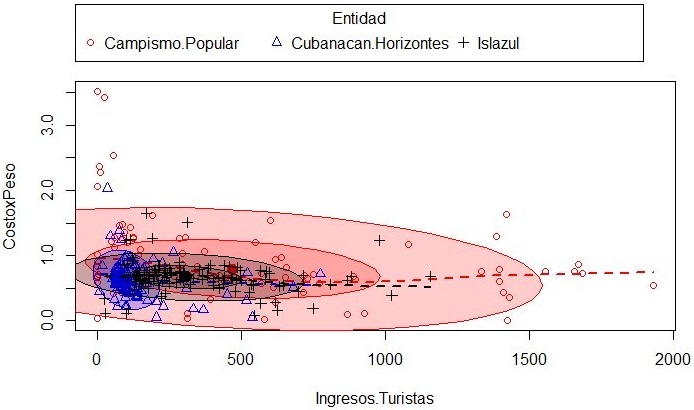
Fig. 3 - Graphs of dispersion with ellipses per tourism entity
Source: R, version 3.5.3
Without the use of hypothesis tests concerning the normality of the data, it can be seen
in figure 4 that this assumption is violated. As shown in the figure itself, the set of
dependent variables does not maintain normality; by definition of invariant normality, the
multivariate normality of the set of dependent variables will not be maintained, and therefore
the MANOVA model would lose validity (Ordaz Sanz et al., 2011).
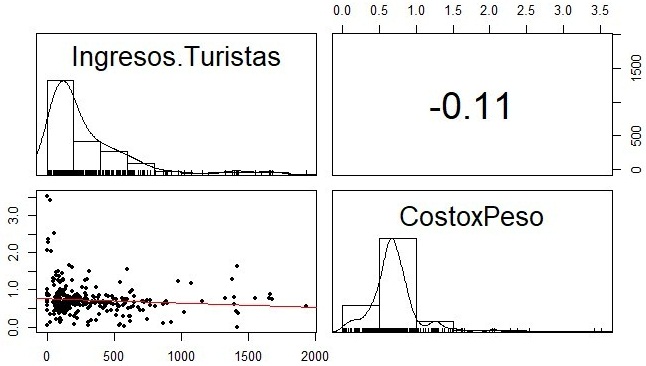
Fig. 4 - Graphs of dispersion with histogram and with correlation coefficient
Source: R, version 3.5.3
Checking the suspicions of the absence of multivariate normality, the multiple normality
tests proposed by Mardia (1970) are performed. These tests are determined by R, giving
probability values, lower than the significance level (p<0.05), rejecting the null hypothesis
(multivariate normality). At this point, it becomes necessary to find an acceptable transformation as
an answer to this problem. There is a method that allows to obtain, in a fast way, a
transformation that provides certain benefits.
Bootstrap, which is based on the idea of treating the sample as a kind of "statistical
universe", sampling repeatedly and using the samples to estimate means, variances, biases and
confidence intervals for the parameters of interest (Ramirez Montoya et al., 2016).
The application of the Bootstrap technique allowed the assumption of data normality to
be met. Next, a more appropriate MANOVA is carried out, with the aim of checking whether
there are differences in the behaviour of the efficiency and effectiveness indicators in the
different tourism entities. R facilitated the application of the MANOVA with their respective
significance tests (Pillai, Wilks, Hotelling and Roy). According to these significance tests (p<0.05), it
can be concluded that there are differences in the parameters: efficiency and
effectiveness between the different entities.
Now we proceed to analyze each dependent variable separately, that is, to perform an
analysis of the variance of a factor to verify in which dependent variable or variables there
are differences between the different entities.
In the output of R, for the analysis of costs by peso, the existence of significant
differences between the entities was verified (p<0.05), with an adjusted coefficient of determination
of 0.9856, which can be translated as the percentage of variability that is explained by
the factors.
Proceeding to analyze the test residues shown in figure 5, it is possible to verify that
the basic assumptions are fulfilled, except for the assumption of equality of variance (Residual
vs. Fitted values). This is due to the influence in terms of variability that the entity Campismo.

Fig. 5 - Residue Graphs for ANOVA of cost by peso
Source: R, version 3.5.3
Also, in R output, it is verified that the probability value is lower than the significance
level, which is interpreted as the existence of statistically significant differences between
these entities, regarding the behavior of the dependent variable income from tourists, with
an adjusted coefficient of determination of 0.9094.
Analyzing the residues of the model (Fig. 6), it can be seen that there is no homogeneity
of variances (Residual vs. Fitted values), which is due to the differences imposed by
Campismo Popular in terms of its own characteristics, with respect to the rest of the other entities.
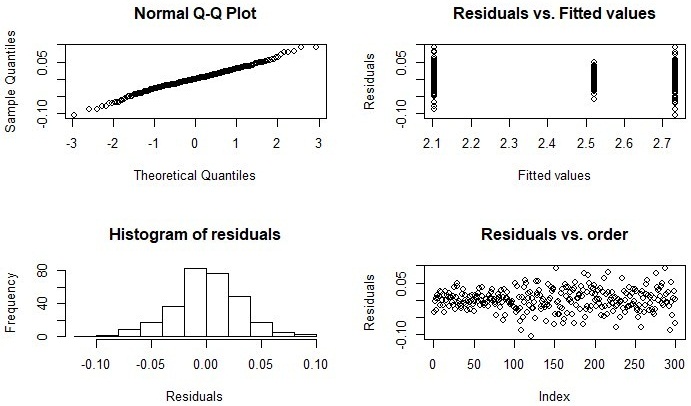
Fig. 6 - Residue graphs for ANOVA of average incomes per tourist
Source: R, version 3.5.3
By repeating the procedure for the analysis of variance, but without including
Campismo Popular, the assumption of homogeneity of variances for the entities Islazul and Cubanacán
is achieved, thus corroborating what was explained above. From here, cleaner results can
be obtained by applying the tool of multivariate data analysis. Figure 7 shows the fulfillment
of this assumption.
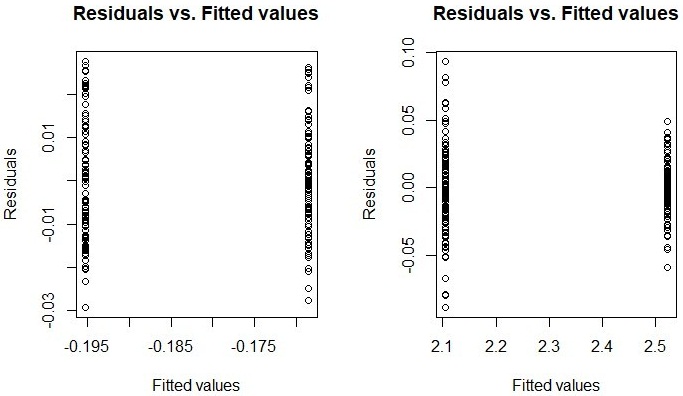
Fig. 7 - Residue graphs to do the analysis of the equal variance assumption
Source: R, version 3.5.3
When carrying out the ANOVA, without including the entity of Campismo Popular, the
results shown by the software for the variables cost per peso and income per tourist, show
significant differences among the entities involved for both indicators (p<0.01), with
determination coefficients of 0.53 and 0.985 respectively.
For the conformation of the composite indicator (Table 1), it was necessary to assign to
each sub-indicator the same weight as the others; in this case, the determination coefficients R2 adding the information by means of a sum (Torres Delgado & López Palomeque, 2017).
The weighting and aggregation are usually done in successive levels, so that previously a series
of variables are weighted and aggregated to construct the sub-indicators related to a
certain dimension and, subsequently, these are added to construct the synthetic indicator (Nardo
et al., 2005). Thus, the indicator for a unit i is defined as 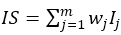 where wj is the weight assigned to the indicator j.
Table 1 - Formulation of efficiency and effectiveness indicators
Entity |
Cost by peso
R2 |
Income per tourist
R2 |
Cost by peso
1-CV |
Income per tourist
1-CV |
Weighted sum |
Ranking |
Cubanacán |
0.5313 |
0.985 |
0.6012 |
0.0794 |
0.3976 |
2 |
Campismo |
0.9856 |
0.9094 |
0.3353 |
0.0208 |
0.3493 |
3 |
Islazul |
0.5313 |
0.985 |
0.6676 |
0.3734 |
0.7224 |
1 |
Source: Own elaboration
As a standardized indicator, the complement of the coefficient of variation (CV) was
used, which measures the degree of homogeneity of the values of the variable. The CV is a
measure of the degree of heterogeneity; it is used primarily to compare periods or stages and
allows comparisons to be made between heterogeneous data sets.
Once the weights wj and the standardized indicator have been determined, the values of
the composite indicator are obtained by means of a weighted sum of the standardized values
of the system's indicators (Parada et al., 2015).
In table 1, it can be seen that the hotel chain with the best results is Islazul, while
Campismo Popular shows a less adequate situation in terms of efficiency and effectiveness, which
is more distant, in terms of scores, from the rest of the entities, above all due to the problems
of efficiency that it presents.
This paper demonstrates the importance of multivariate analysis of variance in the
diagnosis of the efficiency and effectiveness of tourism activity, based on the calculation of a
composite index.
Its application in the province of Pinar del Río, Cuba, made it possible to determine the
scores to build a ranking among the tourism entities, becoming a tool for the strategic analysis of
the sector.
REFERENCES
Avendaño Prieto, B. L., Avendaño Prieto, G., Cruz, W., & Cárdenas Avendaño, A. (2014). Guía
de referencia para investigadores no expertos en el uso de estadística multivariada. Diversitas: Perspectivas
en Psicología, 10(1), 13-27. http://www.scielo.org.co/scielo.php?script=sci_abstract&pid=S1794-99982014000100002
Camacho Rosales, J. (1990). Interpretación del MANOVA: Análisis de la importancia de las
variables dependientes. Investigaciones, 10.
Cuadras, C. M. (2014). Nuevos métodos de análisis multivariante. CMC Editions.
Efron, B. (1979). Bootstrap methods: Another look at jackknife. The Annals of Statistics, 7(1), 1-26.
https://projecteuclid.org/download/pdf_1/euclid.aos/1176344552
Fox, J., Friendly, M., & Weisberg, S. (2013). Hypothesis Tests for Multivariate Linear Models Using
the car Package. The R Journal, 5(1), 39-52. https://doi.org/10.32614/RJ-2013-004
Gil Abreu, S. N. (2014). Bootstrap en poblaciones finitas [Máster Oficial en Estadística
Aplicada]. Universidad de Granada.
Gil Martínez, C. (2018). Métodos de remuestreo y validación de modelos: Validación cruzada y bootstrap.
Mardia, K. V. (1970). Measures of multivariate skewness and kurtosis with applications.
Biometrika, 57(3), 519-530. https://doi.org/10.2307/2334770
Montanero Fernández, J. (2008). Análisis Multivariante. Universidad de Extremadura.
Nardo, M., Saisana, M., Saltelli, A., Tarantola, S., Hoffman, A., & Giovannini, E. (2005). Handbook
on Constructing Composite Indicators: Methodology and User Guide. OECD.
Ordaz Sanz, J. A., Melgar Hiraldo, M. del C., & Rubio Castaño, C. M. (2011). Métodos estadísticos
y econométricos en la empresa y para finanzas. Universidad Pablo de Olavide.
https://www.upo.es/export/portal/com/bin/portal/upo/profesores/jaordsan/profesor/1381243330001_metodos_estadisticos_y_econometricos_en_la_empresa_y_para_finanzas.pdf
Parada, S., Fiallo, J., & Blasco Blasco, O. (2015). Construcción de indicadores sintéticos basados
en juicio experto: Aplicación a una medida integral de la excelencia académica. Revista Electrónica
de Comunicaciones y Trabajos de ASEPUMA, 16(1), 51-67.
https://dialnet.unirioja.es/servlet/articulo?codigo=5601445
Ramírez, I. C., Barrera, C. J., & Correa, J. C. (2013). Efecto del tamaño de muestra y el número
de réplicas bootstrap. Ingeniería y Competitividad, 15(1), 93-101.
Ramírez Montoya, J., Osuna Vergara, I., Rojas Mora, J., & Guerrero Gómez, S. (2016).
Remuestreo Bootstrap y Jackknife en confiabilidad: Caso Exponencial y Weibull. Revista Facultad de
Ingeniería, 25(41), 55-62. http://www.scielo.org.co/scielo.php?script=sci_arttext&pid=S0121-11292016000100006
Ramos Álvarez, M. M. (2017). Curso de análisis de investigaciones con programas
informáticos. Universidad de Jaén.
Salgado Horta, D. (2006). Métodos estadísticos multivariados.
Solanas, A., & Sierra, V. (1992). Bootstrap: Fundamentos e introducción a sus aplicaciones. Anuario
de Psicología, 55, 143-154.
Torres Delgado, A., & López Palomeque, F. (2017). The ISOST index: A tool for studying
sustainable tourism. Journal of Destination Marketing & Management, 8, 281-289.
https://doi.org/10.1016/j.jdmm.2017.05.005
Vallejo, G., Fernández, M. P., Tuero, E., & Livacic Rojas, P. E. (2010). Análisis de medidas
repetidas usando métodos de remuestreo. Anales de Psicología, 26(2), 400-409.
http://www.redalyc.org/articulo.oa?id=16713079025
Conflict of interest:
Authors declare not to have any conflict of interest.
Authors' contribution:
The authors have participated in the writing of the paper and the analysis of the documents.

This work is licensed under a Creative Commons Attribution-NonCommercial 4.0 International License
Copyright (c) Reinier Fernández López, José Alberto Vilalta Alonso, Arely Quintero Silverio, Rebeca María Chávez Gomis