
Cooperativismo y Desarrollo, September-December 2019; 7(3): 377-391
Translated from the original in Spanish
Measuring local development in Isla de la Juventud from different Cuban experiences
Medición del desarrollo local en la Isla de la Juventud desde diferentes experiencias cubanas
Liudyana Domínguez Matos1
1Departamento de Desarrollo Local. Universidad de la Isla de la Juventud "Jesús Montané Oropesa". Isla de la Juventud. Cuba. Email: ldominguez@uij.edu.cu
Received: April 11th, 2019.
Accepted: September 9th, 2019.
ABSTRACT
One of the weaknesses currently identified in the Cuban economy is the theoretical advance on local development and its measurement. Even when it has been gaining space through different experiences throughout Cuba, it must continue to be enriched; that is why this research will address local development in La Isla de la Juventud and its measurement, from different Cuban experiences, assuming as a general objective: to diagnose local development, based on the Municipal Advancement Index, the Municipal Development Index and the Human Development Index in La Isla de la Juventud, in the period 2011-2015. The calculation and analysis of these three indices allowed to know that the territory has had a retrocession according to the Municipal Advancement Index, the Human Development Index and the Municipal Development Index, placing the municipality in a medium development; The figures confirm the economic situation as one of the weaknesses that affect the decline of the pine economy, accompanied by the demographic issue and living conditions becomes a fatal triad to ensure the social welfare desired by people from that region, after being a pilot space to implement development plans aimed at food self-sufficiency, import substitution, promotion of exports, employment generation, development of industry, etc., and everything, as a whole, implies a better quality of life for its inhabitants.
Keywords: local development; indicators; rates
RESUMEN
Una de las debilidades identificadas, actualmente, en la economía cubana, es el avance teórico sobre desarrollo local y su medición. Incluso, cuando ha estado ganando espacio a través de diferentes experiencias a lo largo de toda Cuba, se deben seguir enriqueciendo; es por ello que la presente investigación abordará el desarrollo local en la Isla de la Juventud y su medición, desde diferentes experiencias cubanas, asumiendo como objetivo general: diagnosticar el desarrollo local, a partir del Índice de Avance Municipal, el Índice de Desarrollo Municipal y el Índice de Desarrollo Humano en la Isla de la Juventud, en el período 2011-2015. El cálculo y análisis de estos tres índices permitieron conocer que el territorio ha tenido un retroceso de acuerdo con el Índice de Avance Municipal, el Índice de Desarrollo Humano y el Índice de Desarrollo Municipal , ubicando al municipio en un desarrollo medio; las cifras confirman la situación económica como una de las debilidades que inciden en el retroceso de la economía pinera, acompañado de la temática demográfica y condiciones de vida se vuelve una triada fatal para garantizar el bienestar social que anhelan los pineros, después de ser espacio piloto para implementar planes de desarrollo que tienen por finalidad el autoabastecimiento de alimentos, sustitución de importaciones, fomento de exportaciones, generación de empleo, desarrollo de la industria, etc., y todo, en su conjunto, implique mejor calidad de vida para sus habitantes.
Palabras claves: desarrollo local; indicadores; índices
INTRODUCTION
The term development is understood as a social condition within a country, where the authentic needs of its population are satisfied with the rational and sustainable use of its resources and natural systems; by incorporating the local term, then, it means involving all social actors in conjunction with the government, in pursuit of taking advantage of the endogenous resources of a locality (Alonso Alemán & Bell Heredia, 2013).
However, the evaluation of the level or advance of local development in our country is a weakness in the process of science, technology and innovation management, which has to overcome cultural barriers in all spheres of society and requires the development of tools to measure it in its socioeconomic expression and as a process in itself (Pino, 2009).
To achieve this, indicators are the analytical tools that allow us to improve our knowledge of different aspects of social and economic life, in which we are interested, or about the changes that are taking place. The information it provides helps to provide answers to social problems and to make policy decisions based on empirical evidence (Núñez Jover, 2015).
In La Isla de la Juventud, there are few works dedicated to the subject of local development and its measurement for the pine economy, so eager to have instruments that facilitate, not only the diagnosis of the efficiency of development programs implemented in the territory, also help to guide, with greater accuracy, the public policies conducted by the municipal government (Domínguez, 2015).
In the special municipality, the execution of several development programs are supported by substantial investments in three fundamental lines: tourism, industry and agrifood. It has not yet been selected to question the influence of these programs on the development of the Island economy, despite the existence of valid Cuban experiences to diagnose local development at the municipal level (AMPP, 2012).
In order to diagnose local development in La Isla de la Juventud, the Municipal Advancement Index (MAI) (Domínguez, 2015), Municipal Development Index (MDI) (León, 2009) and the Human Development Index (HDI) (Méndez & Lloret, 2005) in the Isle of Youth will be used as a reference for the period 2011-2015.
MATERIALS AND METHODS
In order to fulfill the objective, the authors relied on the historical-logical method that allowed to know the evolution and development of local development and its measurement in the world and in our country, which allowed the contextualization of the different theoretical elements that support the research.
The analytical-synthetic made possible the accumulation of information related to the theoretical and methodological foundations of the local development movement (concepts, definitions, others), which sustain the subject of the measurement of socioeconomic development.
On the other hand, the empirical methods; of them, the documentary analysis was used to review and analyze the primary documentation that allows the appropriate analysis to discover the precise results, as well as the statistical-mathematical method, used for the standardization of variables, graphical analysis and statistical series.
RESULTS AND DISCUSSION
In order to study local Cuban development, one must start from the fact that it is a country that moves towards socialism, starting from conditions of underdevelopment. In the Cuban economy, the fundamental weight is held by state property and has as a way of regulating the economy, planning.
The need for a territorial development model arose from the triumph of the Revolution, due to the great economic disproportions that existed at that time; however, even when it was and is a necessity, the degrees of centralization of the economy are a barrier to local development in Cuba (Chiarella, 2010).
It is important to mention that local development was also immersed in the process of "rectification of errors and negative tendencies", it suffered the terrible consequences of the collapse of the European socialist system. In the midst of the crisis that the country went through, the economic and social development strategy was oriented towards the concentration and distribution of scarce resources in the hands of the State, so that basic social services are given high priority, which explains why the economy is the pending task for Cubans.
In this context, the policies applied so that the municipalities are capable of self-managing their development are not sufficient; their measurement is vital so that it serves as a compass on the decisions that are taken; hence, this work was useful to identify the most deteriorated dimensions in the pine economy and to be able to generate in the academic and governmental spheres a criterion on the efficiency of the development programs that have been carried out in the territory (Benítez Cárdenas, Hernández Gutiérrez, & Guilarte Valladares, 2015).
Measuring local development in La Isla de la Juventud, from different angles
La Isla de la Juventud has been blessed with natural and non-natural resources, which has turned the territory into one of the Cuban municipalities with the greatest endogenous potential that, rationally exploited, directly pay taxes to guarantee the quality of life of its inhabitants.
However, the mere fact of having them does not imply economic development because, without a rational use, a comprehensive planning that combines investment plans, based on the particularities of the island, which in turn includes a territorial analysis, will not achieve the social welfare expected by the population of this place.
Comparative analysis of the Municipal Advancement Index (MAI) for the period (2008-2012) and (2011-2015).
Bearing in mind that there is previous work with the period (2008-2012), where the MAI was calculated for La Isla de la Juventud, it is proposed to make a comparison with a new period (2011-2015), in order to determine the progress that, in terms of local development, may have had the municipality. It will begin with a comparison between the dimensions that make up the index, as seen through the indicators that make up each dimension (Almaral, 2017).
The dimension Economy and Finance (Graph 1) had a decline of 0.02, explained, because of the seven indicators that compose it, per capita retail circulation fell from 0.46 to 0.25, average salary 0.58 to 0.31 and personal taxes from 0.39 to 0.35; four of them showed progress, remaining as follows: gross added value went from 0.57 to 0.60, labor productivity from 0.36 to 0.37, per capita investments from 0.49 to 0.58, per capita taxes from 0.35 to 0.53; however, the advance in these indicators was discrete since, in general, the dimension showed a retrocession with the analyzed period.
Due to the importance of tax collection for the development of the pine economy, it is necessary to analyze its behavior in the two periods studied because, from the economic point of view, it is the money that the municipal government has to fulfill its functions and, from the social point of view, it makes it possible to assure the social programs and budgeted entities.
Graph 1 - Dimension: Economy and Finance
Source: Elaborated by the authors from the database
The analyzed figures of the collection of taxes in the two periods seen, 2011 moderately exceeds 2008, the rest of the years maintains a downward trend in what is collected by tax; among the causes, which explains it, is the change in the tax law in which it was decided, by the national government, to reduce the tax to state enterprises, in order to stimulate their productivity.
The behavior of the per capita tax indicator with respect to the collection of taxes seems to be a contradiction; however, the explanation lies in the fact that the population of La Isla de la Juventud has been decreasing, so when the indicator (per capita) is calculated, an advance is shown, even though the figures have decreased.
In the period 2008-2011, personal income had an average growth rate of 87%. This was due to the implementation of the non-state sector policy, thus initiating changes to the tax law for this same sector. The setback experienced by the indicator, with respect to the growing trend of personal income in the stages studied, is explained by the marked gap between the figures of the first period and the moderate variation experienced in the second period.
The Living Conditions dimension (Graph 2), had a 0.05 regression of the six indicators that compose it; four of them showed progress, which was as follows: the mortality rate from 0.11, to 0.40; the mortality rate per thousand born from 0.53, to 0.63; the employment rate from 0.48, to 0.52; cultural services from 0.50 to 0.60 and the birth rate dropped from 0.65 to 0.49 and passenger transportation from 0.60 to 0.44; in relation to the last indicator mentioned, passenger transportation drops, when the territory has entered about ten new "Diana" buses, but with less transportation capacity.
Within the dimension, among the indicators that revealed progress are the mortality rate per thousand born, the occupancy rate and cultural services; for this reason, the next lines will be dedicated to the particular analysis of these indicators. The mortality rate per thousand born, the second period, experiences an average behavior of 6.7 figure, which is higher by 0.86 than the stage that preceded it (2008-2012).

Graph 2 - Dimension: Living Conditions
Source: Own elaboration starting with the 2012-2015 IJ Yearbooks
The growth of the employment rate responded to the opening, in 2013, of the non-state sector, which made the rate show a uniform ascent; on the other hand, the state sector experiences a decrease in the workforce as they move from the state sector to the non-state sector, however, there is still about 30% of the working age population that is not part of the economically active population, the latter with an average annual growth rate of 1.3%.
With the decrease of the musical activities, the territory found alternatives in the rescue of the houses of culture. The figures analyzed showed a marked disinterest of people for museums, although in the case of the cultural services indicator showed an advance over the previous period.
Graph 3 - Dimension: Food Security
Source: Elaborated by the authors from the database
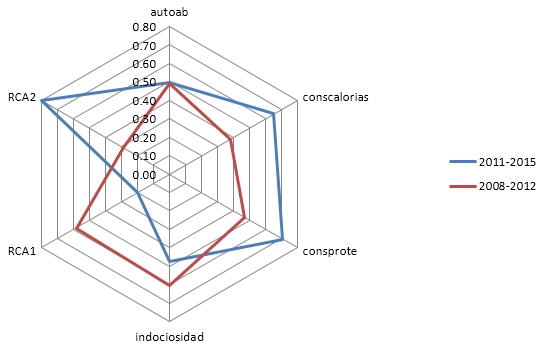
The Food Security dimension (Graph 3) experienced an advance of 0.08, explained by the fact that of the six indicators that make it up, four of them showed progress. They were: calorie consumption at 0.27, self-sufficiency at 0.01, protein consumption at 0.24 and less productive land at 0.51; very productive land fell by 0.38, the idleness index at 0.13; progress in indicators of protein and calorie consumption was the result of the sale of pork at affordable prices, which was widely accepted in the pine population. The low prices of pork were produced by the increase in pork production, which was a response to the implementation of the experiment of selling agricultural inputs to farmers, which included animal feed.
The Social Integration dimension (Graph 4) had a drop of 0.09 because, of the four indicators that compose it, the indicator percent of people attending the election processes showed a drop from 0.50 to 0.36 and percent of women, with higher level degrees, from 0.56 to 0.44. They showed progress: people with labor ties in the non-state sector from 0.31 to 0.49 and percent of people who attend the accountability of the delegates from 0.52 to 0.56 and the advance of the indicator, people with labor ties, in the non-state sector, is explained by the opening of new forms of non-state management.

Graph 4 - Dimension: Social Integration
Source: Elaborated by the authors from the database
The Innovation Management dimension (Chart 5) had an advance of 0.02; of the four indicators that compose it, two of them showed progress, which was as follows: real expense/planned expense for generalization of solutions from 0.29 to 0.40; representation % of the substitution of imports for the generalization of solutions, through tasks, from 0.60 to 0.61 and retroceded relation between the saving by concept of innovations and rationalizations and quantity of innovations and rationalizations of 0.65 to 0.32; representation % of the saving of resources by the generalization of solutions, through tasks, of 0.58 to 0.53; nevertheless, it is of importance to emphasize the advance in the indicator on the execution of the real planned expense and the real executed by solutions.

Graph 5 - Dimension: Innovation Management
Source: Elaborated by the authors from the database
The Environmental dimension (Graph 6) had an advance of 0.10; unfortunately, the figures do not reflect local development, although its three indicators acquired greater values. The pesticide use indicator went from 0.52 to 0.64; fertilizer use from 0.54 to 0.64; its numerical increase indicates that the municipality, since 2013 as part of the experiment in the sale of agricultural inputs to peasants and entities, encourages the purchase of chemicals for large quantities that are very harmful to the environment and, in particular, to soils. It is important to mention that it is not yet the culture of the pine producers to encourage production with organic fertilizers. With respect to forest cover, increased from 0.38 to 0.44, an indicator that is positive for preserving the environment.
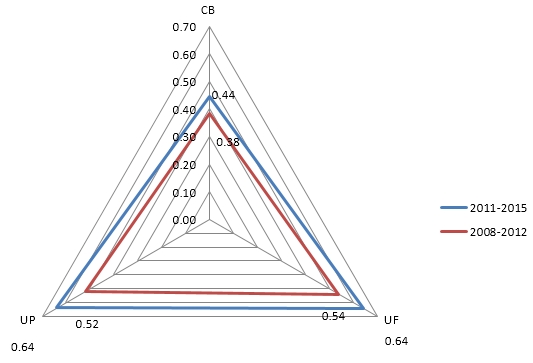
Graph 6 - Dimension: Environmental
Source: Elaborated by the authors from the database
The Demographic dimension (Graph 7) had a decline of 0.07; of six indicators that compose it, three of them perceived lower figures: the economically active population from 0.69 to 0.64; the population density from 0.74 to 0.23; the population aging from 0.48 to 0.43 and the total fertility rate advanced from 041 to 0.47, the migratory balance from 0.26 to 0.52, the annual growth rate from 0.53 to 0.74; however, the advance, in these three indicators, did not favorably influence the advancement of the dimension.

Graph 7 - Dimension: Demographic
Source: Elaborated by the authors from the database
After the study of the dimensions that compose the MAI, it is necessary to establish the comparison of the index between the two periods (Graph 8). From the analysis, it could be known that the Isle of Youth, in terms of socio-economic development, fell back; it went from a MAI (2008-2012) = 0.795 to MAI (2011-2015) = 0.556, a difference of 0.238.

Graph 8 - Comparison of the 2008-2012 and 2011-2015 MAI periods
Source: Elaborated by the authors from the database
When making the summary by dimensions, one can affirm: three of them show progress; Food Security from 0.49 to 0.55; Environmental from 0.47 to 0.58 and Local Innovation Management from 0.49 to 0.51; however, the remaining four show regression, and are in the following order: Economy and finance from 0.45 to 0.43; Living conditions from 0.57 to 0.52; Demography from 0.58 to 0.51; Social Integration from 0.55 to 0.46. It is not understood that, in the eyes of the pine society, are seen the new technologies, agricultural machinery, inputs, animal food, in addition, the effort that is carrying out the national and local government to carry forward the pine economy, still, shows a setback, with the results of this research.
Comparative analysis of the selected indices, case study: La Isla de la Juventud for the period 2011-2015.
In order to carry out a more complete research on local development in La Isla de la Juventud in the period analyzed, the calculation of the Human Development Index, the Municipal Development Index and the Municipal Advancement Index were taken into account, which will give a more complete vision on the socioeconomic development in the territory.
The HDI has been calculated for Cuba at various times and at the level of provincial research; the Island has a first calculated experience that placed it in a medium development for this work and because of the interest of the authors, it was determined for the 2011-2015 stage (Graph 9).

Graph 9 - Human Development Index for La Isla de la Juventud, 2011-2015
Source: Elaborated by the authors from the database
Of the six indicators that make up the index, the most representative was the occupancy rate that shows an annual rate of decrease, average of 2.95%; the least significant, but no less important, was maternal mortality since in the territory fourteen years ago there were no maternal deaths, which constitutes a positive result in terms of public health. In a conclusive manner, the results obtained and, taking into account the scale established to determine the level of development, in the case of Pinar del Río, the HDI=0.532 maintains an average development.
On the other hand, the MDI, which is composed of three dimensions, will also provide information on the level of socioeconomic development, taking into consideration nearly eight shared indicators in their respective dimensions.
Graph 10 reflects the behavior of the MDI by dimensions; of the three dimensions that make it up, the Environmental dimension experiences the most representative figure, made up of two indicators. The water coverage indicator was crucial because the territory covers 100% of the population; this characteristic places us in an advantageous situation in relation to the rest of the country since the municipality has 14 reservoirs that behave, as an annual average, close to 75% of their filling capacity and the hydraulic networks have not only been replaced by new ones, they have also been extended to areas that did not have them.

Graph 10 - Municipal Development Index (MDI) Isla de la Juventud, 2011-2015
Source: Elaborated by the authors from the database
The dimension with the lowest figure in the index was the economic one, composed by two indicators, of which the most irrelevant was the relation mercantile circulation/population, who experienced an average annual rate of decrease of 9.89%; the MDI=0.634 from the scale defined for the index; the municipality of Pinar del Río presents an average development.
Making a synthesis of what has been said so far, with the incorporation of the results obtained from the MAI, it can be concluded that the Island, in two of its indices, showed average development and the economic issue is the most affected, edge that becomes crucial to conduct economic development, from the use of its endogenous resources. Including what was seen with the MAI, the figures confirm the economic situation as one of the weaknesses that affect the decline of the pine economy which, from the demographic and living conditions becomes a fatal triad to guarantee the social welfare that the pine growers yearn for, after being a pilot space to implement development plans in which its main objective is self-sufficiency of food, import substitution, promotion of exports, generation of employment, development of the industry, etc., and everything, as a whole, will revert in the quality of life.
From the calculations and analyses carried out in this work, it was possible to know that, in the case of the pine territory, the comparative analysis of the Municipal Advancement Index of the two selected five-year periods allowed us to know that of the seven dimensions that compose it: three of them show progress (Food Safety, Environmental and Local Innovation Management); however, the remaining ones go backwards, they were in the following order: Economy and finance, Living conditions, Demography and Social Integration, which resulted in a decline of the pine economy by 0.238.
With the comparison of the results obtained from the MAI, HDI and MDI, it can be concluded that the Island, in two of its indices, showed average development and the economic issue was the most affected, edge that becomes crucial to drive economic development, from the use of its endogenous resources. Including the analyzed, with the MAI, the figures confirm the economic situation as one of the weaknesses that affect the decline of the pine economy that, accompanied by the demographic issue and living conditions become a triad to ensure the social welfare that pine foresters yearn for.
REFERENCES
Almaral, L. E. (2017). La medición del desarrollo local en la Isla de la Juventud desde diferentes experiencias cubanas (2011-2015) (Diploma en Licenciatura en Contabilidad y Finanzas). Universidad de Isla de la Juventud «Jesús Montané Oropesa», Nueva Gerona.
Alonso Alemán, A. M., & Bell Heredia, R. E. (2013). Desarrollo territorial a escala local. La Habana: Editorial UH.
AMPP. (2012). Programa de Desarrollo Integral Isla de la Juventud. Asamblea Municipal del Poder Popular Isla de la Juventud.
Benítez Cárdenas, F., Hernández Gutiérrez, D. N., & Guilarte Valladares, A. (2015). El conocimiento, la innovación, y el desarrollo local. El papel de las universidades. Congreso Universidad, 4(1), 311-322.
Chiarella, R. (2010). Planificación del desarrollo territorial: algunas precisiones. Espacio y Desarrollo, (22), 77-102.
Domínguez, L. (2015). La medición del desarrollo local. El Índice de Avance Municipal en la Isla de la Juventud (2008-2012).
León, I. (2009). Ejemplo de cálculo del IDM para la provincia Granma. Granma.
Méndez, E., & Lloret, M. del C. (2005). Desarrollo Humano a nivel Territorial en Cuba. Período 1985-2001. Revista Cubana de Salud Pública, 31(2). Recuperado a partir de http://scielo.sld.cu/scielo.php?script=sci_arttext&pid=S0864-34662005000200003&lng=es&tlng=es
Núñez Jover, J. (2015). Universidad, conocimiento, innovación y desarrollo local. La Habana: Félix Varela.
Pino, R. (2009). Medición del desarrollo socio económico local.
